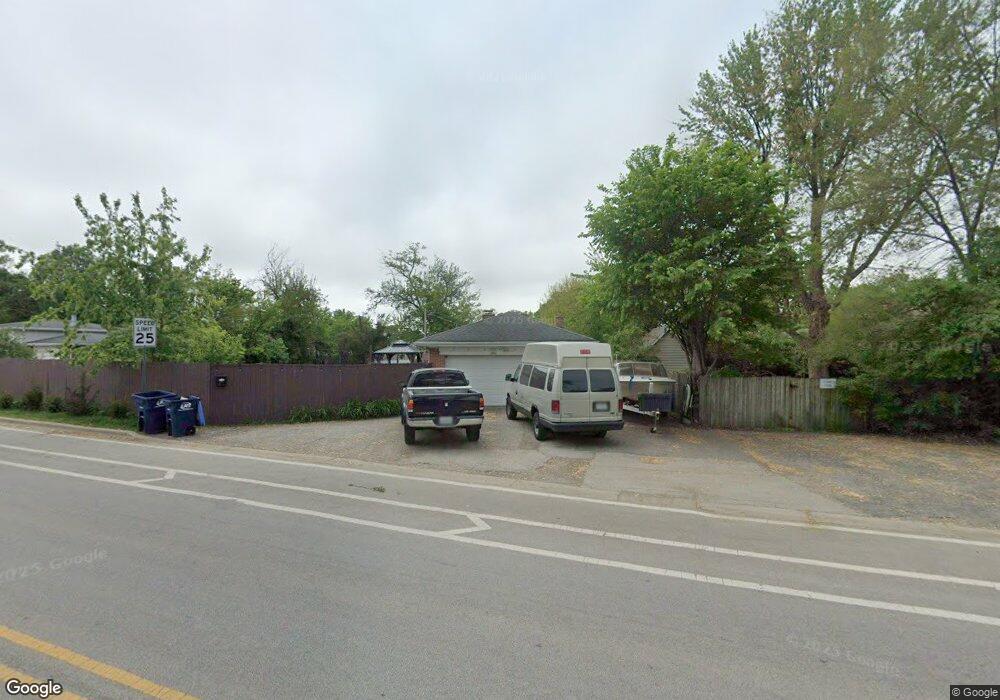
1801 E Algonquin Rd Des Plaines, IL 60016
Estimated Value: $357,000 - $376,072
2
Beds
2
Baths
1,288
Sq Ft
$287/Sq Ft
Est. Value
About This Home
This home is located at 1801 E Algonquin Rd, Des Plaines, IL 60016 and is currently estimated at $369,018, approximately $286 per square foot. 1801 E Algonquin Rd is a home located in Cook County with nearby schools including Central Elementary School, Chippewa Middle School, and Maine West High School.
Ownership History
Date
Name
Owned For
Owner Type
Purchase Details
Closed on
Jun 4, 2020
Sold by
Nawrot Leopold and Nawrot Anna
Bought by
Nawrot Leopold and Nawrot Anna
Current Estimated Value
Purchase Details
Closed on
Jun 15, 2010
Sold by
Deutsche Bank National Trust Company
Bought by
Nawrot Leopold and Nawrot Anna
Purchase Details
Closed on
Jan 20, 2010
Sold by
Sut
Bought by
Deutsche Bank National Trust Company
Purchase Details
Closed on
Mar 8, 2005
Sold by
Dubs Suzette and Zabinski Jan
Bought by
Sut Jacek and Sut Janusz
Home Financials for this Owner
Home Financials are based on the most recent Mortgage that was taken out on this home.
Original Mortgage
$219,000
Interest Rate
5.12%
Mortgage Type
Unknown
Purchase Details
Closed on
May 25, 2000
Sold by
Zabinski Edmund and Zabinski Shirley
Bought by
Zabinski Edmund and Zabinski Shirley
Create a Home Valuation Report for This Property
The Home Valuation Report is an in-depth analysis detailing your home's value as well as a comparison with similar homes in the area
Home Values in the Area
Average Home Value in this Area
Purchase History
| Date | Buyer | Sale Price | Title Company |
|---|---|---|---|
| Nawrot Leopold | -- | Attorney | |
| Nawrot Leopold | $142,000 | Cti | |
| Deutsche Bank National Trust Company | -- | None Available | |
| Sut Jacek | $274,000 | Chicago Title Insurance Comp | |
| Zabinski Edmund | -- | -- |
Source: Public Records
Mortgage History
| Date | Status | Borrower | Loan Amount |
|---|---|---|---|
| Previous Owner | Sut Jacek | $219,000 |
Source: Public Records
Tax History
| Year | Tax Paid | Tax Assessment Tax Assessment Total Assessment is a certain percentage of the fair market value that is determined by local assessors to be the total taxable value of land and additions on the property. | Land | Improvement |
|---|---|---|---|---|
| 2025 | $7,819 | $38,000 | $7,920 | $30,080 |
| 2024 | $7,819 | $29,655 | $6,600 | $23,055 |
| 2023 | $8,234 | $29,655 | $6,600 | $23,055 |
| 2022 | $8,234 | $32,000 | $6,600 | $25,400 |
| 2021 | $6,307 | $20,519 | $5,720 | $14,799 |
| 2020 | $6,201 | $20,519 | $5,720 | $14,799 |
| 2019 | $6,205 | $23,056 | $5,720 | $17,336 |
| 2018 | $6,377 | $21,322 | $5,060 | $16,262 |
| 2017 | $5,272 | $21,322 | $5,060 | $16,262 |
| 2016 | $6,156 | $24,651 | $5,060 | $19,591 |
| 2015 | $4,610 | $17,872 | $4,400 | $13,472 |
| 2014 | $4,529 | $17,872 | $4,400 | $13,472 |
| 2013 | $4,364 | $17,087 | $4,400 | $12,687 |
Source: Public Records
Map
Nearby Homes
- 1700 E Forest Ave
- 1630 Henry Ave
- 1990 Berry Ln
- 1638 Oakwood Ave
- 1649 Ashland Ave Unit 501
- 1524 Oakwood Ave
- 1600 E Thacker St Unit 513
- 1640 S River Rd
- 905 Center St Unit B208
- 1380 Oakwood Ave Unit 306
- 711 S River Rd Unit 617
- 711 S River Rd Unit 704
- 770 Pearson St Unit 808
- 900 Center St Unit 3A
- 1645 Illinois St
- 1685 Mill St Unit 409
- 750 Pearson St Unit 904
- 650 S River Rd Unit 812
- 821 Lexington Cir E
- 1689 S Elm St
- 1816 Stewart Ave
- 1820 Stewart Ave
- 1825 E Algonquin Rd
- 1227 S River Rd
- 1211 S River Rd
- 1800 Stewart Ave
- 1211 S River Rd
- 1832 Stewart Ave
- 1796 Stewart Ave
- 1842 Stewart Ave
- 1800 E Algonquin Rd
- 1788 E Algonquin Rd
- 1820 E Algonquin Rd
- 1847 E Algonquin Rd
- 1847 E Algonquin Rd
- 1780 E Algonquin Rd
- 1816 E Algonquin Rd
- 1255 S River Rd
- 1819 Stewart Ave
- 1193 S River Rd
Your Personal Tour Guide
Ask me questions while you tour the home.