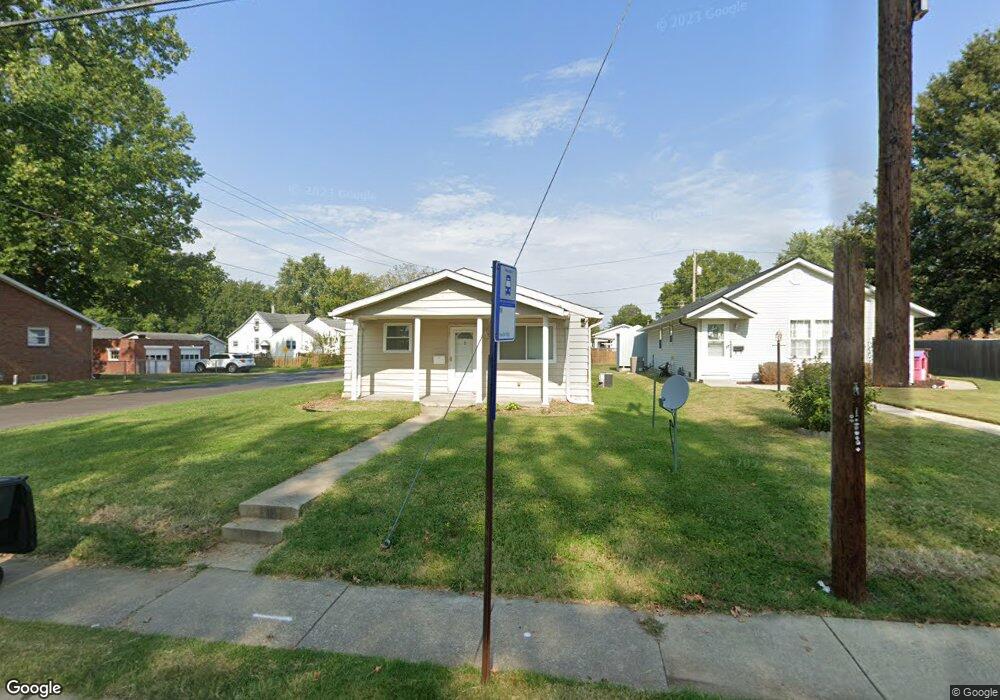
1801 E B St Belleville, IL 62221
Estimated Value: $110,000 - $125,000
Studio
--
Bath
1,000
Sq Ft
$117/Sq Ft
Est. Value
About This Home
This home is located at 1801 E B St, Belleville, IL 62221 and is currently estimated at $116,674, approximately $116 per square foot. 1801 E B St is a home located in St. Clair County with nearby schools including Jefferson Elementary School, West Jr High School, and St Teresa Catholic School.
Ownership History
Date
Name
Owned For
Owner Type
Purchase Details
Closed on
Sep 25, 2015
Sold by
Shepherd Jacqueline F
Bought by
Shepherd Jacqueline
Current Estimated Value
Purchase Details
Closed on
Nov 21, 2006
Sold by
Clendenin Tracey
Bought by
Shepherd Jacqueline F
Home Financials for this Owner
Home Financials are based on the most recent Mortgage that was taken out on this home.
Original Mortgage
$81,900
Outstanding Balance
$57,093
Interest Rate
9.65%
Mortgage Type
Balloon
Estimated Equity
$59,581
Purchase Details
Closed on
Jan 21, 2002
Sold by
Atkinson John and Clark Lois
Bought by
Clendenin Tracey
Home Financials for this Owner
Home Financials are based on the most recent Mortgage that was taken out on this home.
Original Mortgage
$64,424
Interest Rate
6.92%
Mortgage Type
FHA
Create a Home Valuation Report for This Property
The Home Valuation Report is an in-depth analysis detailing your home's value as well as a comparison with similar homes in the area
Home Values in the Area
Average Home Value in this Area
Purchase History
| Date | Buyer | Sale Price | Title Company |
|---|---|---|---|
| Shepherd Jacqueline | -- | Paradise Settlement Services | |
| Shepherd Jacqueline F | $82,000 | Fatic | |
| Clendenin Tracey | $65,000 | -- |
Source: Public Records
Mortgage History
| Date | Status | Borrower | Loan Amount |
|---|---|---|---|
| Open | Shepherd Jacqueline F | $81,900 | |
| Previous Owner | Clendenin Tracey | $64,424 |
Source: Public Records
Tax History
| Year | Tax Paid | Tax Assessment Tax Assessment Total Assessment is a certain percentage of the fair market value that is determined by local assessors to be the total taxable value of land and additions on the property. | Land | Improvement |
|---|---|---|---|---|
| 2024 | $1,281 | $25,565 | $4,134 | $21,431 |
| 2023 | $1,058 | $22,266 | $4,051 | $18,215 |
| 2022 | $866 | $20,048 | $3,649 | $16,399 |
| 2021 | $1,848 | $18,533 | $3,373 | $15,160 |
| 2020 | $1,189 | $17,525 | $3,189 | $14,336 |
| 2019 | $1,271 | $18,271 | $3,194 | $15,077 |
| 2018 | $1,230 | $17,876 | $3,125 | $14,751 |
| 2017 | $1,221 | $17,750 | $3,103 | $14,647 |
| 2016 | $1,200 | $17,373 | $3,037 | $14,336 |
| 2014 | $1,453 | $21,711 | $3,152 | $18,559 |
| 2013 | $1,487 | $22,021 | $3,197 | $18,824 |
Source: Public Records
Map
Nearby Homes
- 1801 E C St
- 130 N Indiana Ave
- 112 Colony Dr
- 1804 Muren Blvd
- 139 Kansas Ave
- 1715 Muren Blvd
- 1918 E C St
- 111 Kansas Ave
- 1825 Muren Blvd
- 1801 E Belle Ave
- 1915 Muren Blvd
- 38 N Michigan Ave
- 2407 E Main St
- 2104 E C St
- 1227 E B St Unit 1227/1229
- 2105 E B St
- 2417 E Main St Unit REAR
- 1715 Scheel St
- 1803 Scheel St
- 13 Beth Ann Dr
Your Personal Tour Guide
Ask me questions while you tour the home.