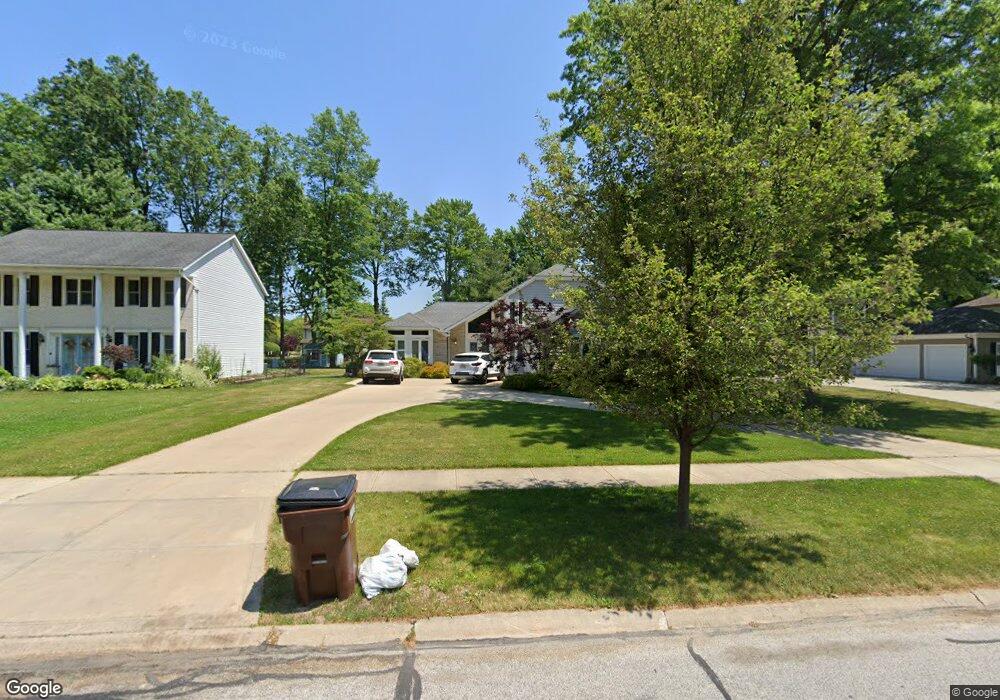
1801 Holdens Arbor Run Westlake, OH 44145
Estimated Value: $480,000 - $560,000
3
Beds
4
Baths
2,644
Sq Ft
$194/Sq Ft
Est. Value
About This Home
This home is located at 1801 Holdens Arbor Run, Westlake, OH 44145 and is currently estimated at $513,110, approximately $194 per square foot. 1801 Holdens Arbor Run is a home located in Cuyahoga County with nearby schools including Dover Intermediate School, Lee Burneson Middle School, and Westlake High School.
Ownership History
Date
Name
Owned For
Owner Type
Purchase Details
Closed on
Dec 17, 2009
Sold by
Houser Kevin J and Houser Kristen L
Bought by
Houser Kristen L
Current Estimated Value
Purchase Details
Closed on
Jan 16, 2003
Sold by
Blankenship Marjorie and Blankenship Marjorie A
Bought by
Houser Kevin J and Houser Kristen L
Home Financials for this Owner
Home Financials are based on the most recent Mortgage that was taken out on this home.
Original Mortgage
$226,000
Outstanding Balance
$97,187
Interest Rate
6.13%
Estimated Equity
$415,923
Purchase Details
Closed on
Aug 20, 1996
Sold by
Orr Paul T
Bought by
Blankenship Marjorie A
Home Financials for this Owner
Home Financials are based on the most recent Mortgage that was taken out on this home.
Original Mortgage
$239,400
Interest Rate
6.88%
Mortgage Type
New Conventional
Purchase Details
Closed on
Dec 22, 1983
Bought by
Orr Paul T
Purchase Details
Closed on
Sep 22, 1983
Bought by
Hennie Homes Inc
Purchase Details
Closed on
Jan 1, 1982
Bought by
Rockport Dev Corp
Create a Home Valuation Report for This Property
The Home Valuation Report is an in-depth analysis detailing your home's value as well as a comparison with similar homes in the area
Home Values in the Area
Average Home Value in this Area
Purchase History
| Date | Buyer | Sale Price | Title Company |
|---|---|---|---|
| Houser Kristen L | -- | Attorney | |
| Houser Kevin J | $282,500 | Rockwell Title | |
| Blankenship Marjorie A | $252,000 | -- | |
| Orr Paul T | $130,100 | -- | |
| Hennie Homes Inc | -- | -- | |
| Rockport Dev Corp | -- | -- |
Source: Public Records
Mortgage History
| Date | Status | Borrower | Loan Amount |
|---|---|---|---|
| Open | Houser Kevin J | $226,000 | |
| Closed | Blankenship Marjorie A | $239,400 |
Source: Public Records
Tax History Compared to Growth
Tax History
| Year | Tax Paid | Tax Assessment Tax Assessment Total Assessment is a certain percentage of the fair market value that is determined by local assessors to be the total taxable value of land and additions on the property. | Land | Improvement |
|---|---|---|---|---|
| 2024 | $7,146 | $150,850 | $33,145 | $117,705 |
| 2023 | $6,596 | $119,040 | $26,320 | $92,720 |
| 2022 | $6,491 | $119,035 | $26,320 | $92,715 |
| 2021 | $6,499 | $119,040 | $26,320 | $92,720 |
| 2020 | $6,559 | $110,220 | $24,360 | $85,860 |
| 2019 | $6,360 | $314,900 | $69,600 | $245,300 |
| 2018 | $6,463 | $110,220 | $24,360 | $85,860 |
| 2017 | $6,609 | $107,240 | $24,150 | $83,090 |
| 2016 | $6,574 | $107,240 | $24,150 | $83,090 |
| 2015 | $5,980 | $107,240 | $24,150 | $83,090 |
| 2014 | $5,980 | $95,760 | $21,560 | $74,200 |
Source: Public Records
Map
Nearby Homes
- 28323 Farrs Garden Path
- 1900 Sperrys Forge Trail
- 29379 Detroit Rd
- 29363 Detroit Rd Unit 5
- 28167 Zinfandel Ct
- Bowman Plan at Hope Pointe Place
- Ashton Plan at Hope Pointe Place
- 29331 Graystone Dr
- 1721 Merlot Ln
- 28744 Woodmill Dr
- 28200 Detroit Rd Unit D3
- 28140 Detroit Rd Unit D3
- 1476 Bobby Ln Unit 7
- 27923 Hilliard Blvd
- 1625 Cedarwood Dr Unit 218
- 0 Hilliard Blvd Unit 5150693
- 0 Hilliard Blvd Unit 5128276
- 1480 Cedarwood Dr Unit 21F
- 1510 Alder Ln Unit 7C
- 879 S Parkside Dr
- 1793 Holdens Arbor Run
- 1809 Holdens Arbor Run
- 1785 Holdens Arbor Run Unit R
- 1785 Holdens Arbor Run
- 1817 Holdens Arbor Run
- 1798 Settlers Reserve Oval
- 1790 Settlers Reserve Oval
- 1804 Settlers Reserve Oval
- 1777 Holdens Arbor Run
- 1810 Settlers Reserve Oval
- 1800 Holdens Arbor Run
- 1782 Settlers Reserve Way
- 1825 Holdens Arbor Run
- 1808 Holdens Arbor Run
- 1792 Holdens Arbor Run
- 1824 Holdens Arbor Run
- 1784 Holdens Arbor Run
- 1774 Settlers Reserve Way
- 1769 Holdens Arbor Run
- 1816 Settlers Reserve Oval