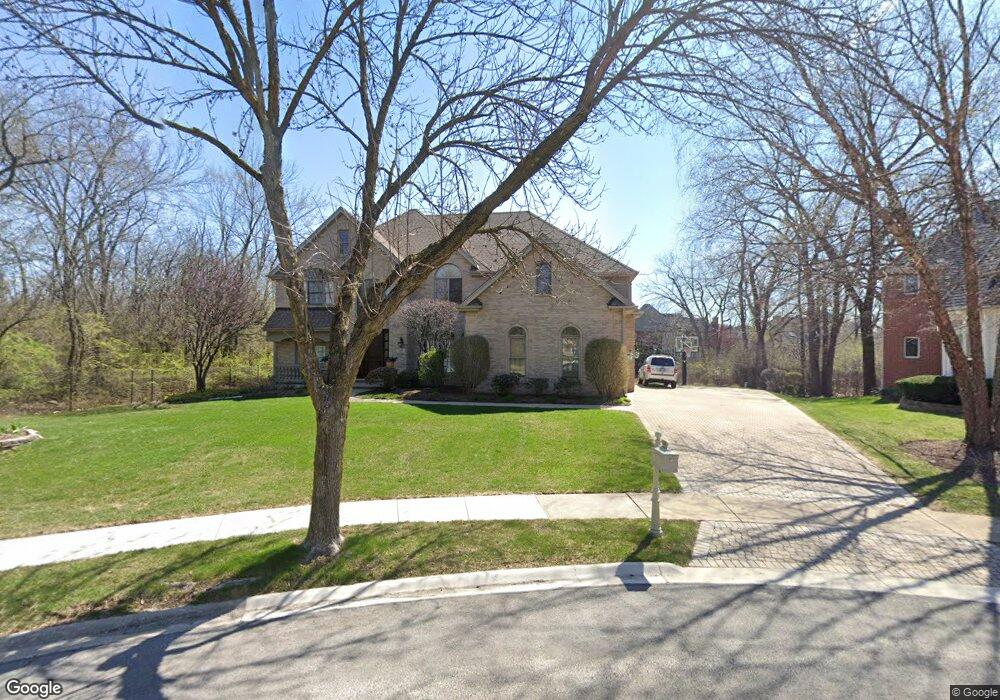
1801 Kelly Ct Darien, IL 60561
Estimated Value: $680,000 - $1,023,000
--
Bed
1
Bath
4,000
Sq Ft
$225/Sq Ft
Est. Value
About This Home
This home is located at 1801 Kelly Ct, Darien, IL 60561 and is currently estimated at $900,088, approximately $225 per square foot. 1801 Kelly Ct is a home located in DuPage County with nearby schools including Mark Delay School, Lace Elementary School, and Eisenhower Jr High School.
Ownership History
Date
Name
Owned For
Owner Type
Purchase Details
Closed on
Oct 15, 2009
Sold by
Healy William L and Healy Constance M
Bought by
Healy Constance M and Healy William
Current Estimated Value
Purchase Details
Closed on
Jul 4, 1999
Sold by
Guernica Antonio and Guernica Mary
Bought by
Healy William L and Healy Constance M
Home Financials for this Owner
Home Financials are based on the most recent Mortgage that was taken out on this home.
Original Mortgage
$325,000
Outstanding Balance
$87,015
Interest Rate
7%
Estimated Equity
$813,073
Purchase Details
Closed on
Jul 23, 1995
Sold by
Beverly Trust Company
Bought by
Guernica Antonio and Guernica Mary
Home Financials for this Owner
Home Financials are based on the most recent Mortgage that was taken out on this home.
Original Mortgage
$410,000
Interest Rate
7.75%
Purchase Details
Closed on
Dec 2, 1994
Sold by
American National Bk & Tr Co Of Chicago
Bought by
Beverly Trust Company
Create a Home Valuation Report for This Property
The Home Valuation Report is an in-depth analysis detailing your home's value as well as a comparison with similar homes in the area
Home Values in the Area
Average Home Value in this Area
Purchase History
| Date | Buyer | Sale Price | Title Company |
|---|---|---|---|
| Healy Constance M | -- | None Available | |
| Healy William L | $667,500 | -- | |
| Guernica Antonio | $495,000 | -- | |
| Beverly Trust Company | $135,000 | -- |
Source: Public Records
Mortgage History
| Date | Status | Borrower | Loan Amount |
|---|---|---|---|
| Open | Healy William L | $325,000 | |
| Previous Owner | Guernica Antonio | $410,000 |
Source: Public Records
Tax History Compared to Growth
Tax History
| Year | Tax Paid | Tax Assessment Tax Assessment Total Assessment is a certain percentage of the fair market value that is determined by local assessors to be the total taxable value of land and additions on the property. | Land | Improvement |
|---|---|---|---|---|
| 2024 | $16,995 | $262,193 | $90,788 | $171,405 |
| 2023 | $16,361 | $241,030 | $83,460 | $157,570 |
| 2022 | $16,658 | $245,710 | $85,090 | $160,620 |
| 2021 | $16,104 | $242,910 | $84,120 | $158,790 |
| 2020 | $15,858 | $238,100 | $82,450 | $155,650 |
| 2019 | $15,350 | $228,460 | $79,110 | $149,350 |
| 2018 | $14,910 | $216,570 | $78,580 | $137,990 |
| 2017 | $14,527 | $208,400 | $75,620 | $132,780 |
| 2016 | $14,227 | $198,890 | $72,170 | $126,720 |
| 2015 | $16,338 | $216,920 | $67,900 | $149,020 |
| 2014 | $16,736 | $218,530 | $66,020 | $152,510 |
| 2013 | $16,221 | $217,510 | $65,710 | $151,800 |
Source: Public Records
Map
Nearby Homes
- 1813 Kelly Ct
- 6722 Sweetbriar Ln
- 1408 Spruce Ln
- 1409 S Williams St
- 1301 S Williams St Unit 2
- 220 Memory Ln Unit 3
- 1209 W Charles Ln
- 1208 Connamara Ct
- 714 W 63rd St Unit 202
- 1524 Crab Tree Dr
- 61 Pier Dr Unit 202
- 55 W 64th St Unit 202
- 67 W 64th St Unit 101
- 55 W 64th St Unit 102
- 1313 Cass Ln E Unit 301
- 47 W Pier Dr Unit 102
- 1526 Shelley Ct
- 6901 Meadowcrest Dr
- 1145 Lacebark Ct
- 419 63rd St
- 1803 Kelly Ct
- 1805 Kelly Ct Unit 5
- 6824 Bantry Ct
- 6820 Bantry Ct Unit 4
- 6828 Bantry Ct
- 1800 Darien Club Dr
- 1712 Darien Club Dr
- 1818 Kelly Ct
- 1708 Darien Club Dr
- 1804 Darien Club Dr
- 1817 Kelly Ct
- 6832 Bantry Ct
- 1808 Darien Club Dr
- 6821 Bantry Ct
- 1822 Kelly Ct
- 1821 Kelly Ct
- 1812 Darien Club Dr
- 6836 Bantry Ct
- 6713 Sweetbriar Ln
- 6825 Bantry Ct