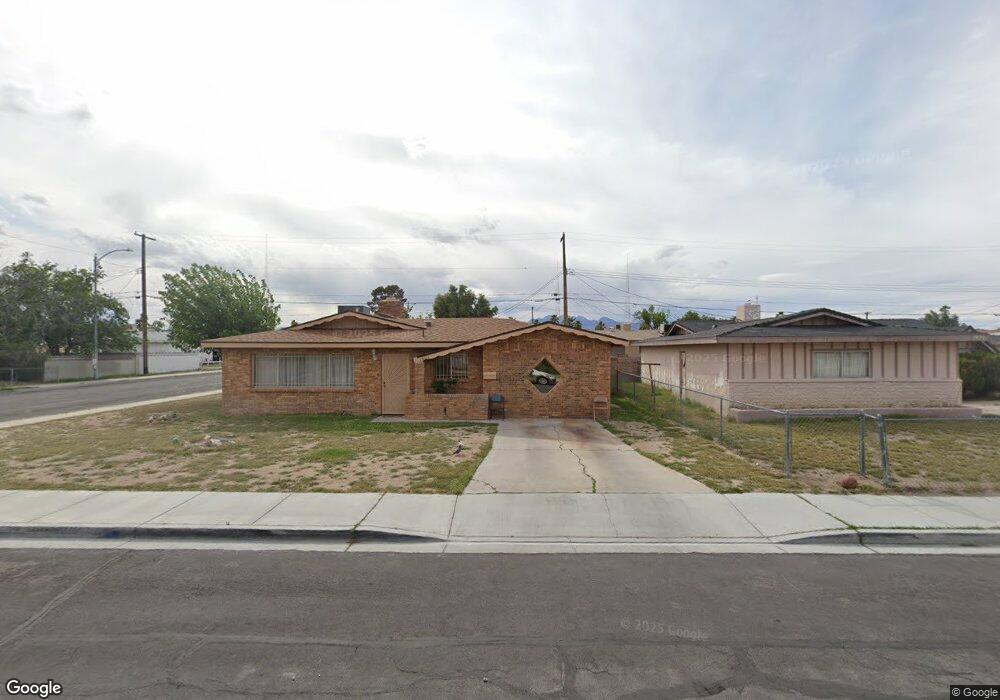
1801 Ludwig Dr Las Vegas, NV 89106
West Las Vegas NeighborhoodEstimated Value: $306,993 - $327,000
3
Beds
2
Baths
1,358
Sq Ft
$231/Sq Ft
Est. Value
About This Home
This home is located at 1801 Ludwig Dr, Las Vegas, NV 89106 and is currently estimated at $313,248, approximately $230 per square foot. 1801 Ludwig Dr is a home located in Clark County with nearby schools including Ollie Detwiler Elementary School, West Prepatory Academy At Charlles I West Hall Sec, and Western High School.
Ownership History
Date
Name
Owned For
Owner Type
Purchase Details
Closed on
Sep 10, 2021
Sold by
Martin Bobby R
Bought by
Martin Alicia Lagwen
Current Estimated Value
Purchase Details
Closed on
Mar 1, 2021
Sold by
Duncan Jewel L
Bought by
Munerlyn Charles
Home Financials for this Owner
Home Financials are based on the most recent Mortgage that was taken out on this home.
Original Mortgage
$211,105
Interest Rate
2.7%
Mortgage Type
FHA
Purchase Details
Closed on
Nov 8, 2006
Sold by
Duncan Jewel L and Duncan Joe
Bought by
Duncan Joe and Duncan Jewel L
Home Financials for this Owner
Home Financials are based on the most recent Mortgage that was taken out on this home.
Original Mortgage
$372,000
Interest Rate
6.5%
Mortgage Type
Reverse Mortgage Home Equity Conversion Mortgage
Purchase Details
Closed on
Aug 30, 1999
Sold by
Munerlyn Jewel L and Munerlyn Charles E
Bought by
Duncan Jewel L and Munerlyn Charles E
Create a Home Valuation Report for This Property
The Home Valuation Report is an in-depth analysis detailing your home's value as well as a comparison with similar homes in the area
Home Values in the Area
Average Home Value in this Area
Purchase History
| Date | Buyer | Sale Price | Title Company |
|---|---|---|---|
| Martin Alicia Lagwen | -- | Nevada State Title | |
| Munerlyn Charles | -- | Nevada State Title | |
| Munerlyn Charles | $215,000 | Nevada State Title | |
| Duncan Joe | -- | None Available | |
| Duncan Jewel L | -- | -- |
Source: Public Records
Mortgage History
| Date | Status | Borrower | Loan Amount |
|---|---|---|---|
| Previous Owner | Munerlyn Charles | $211,105 | |
| Previous Owner | Duncan Joe | $372,000 |
Source: Public Records
Tax History Compared to Growth
Tax History
| Year | Tax Paid | Tax Assessment Tax Assessment Total Assessment is a certain percentage of the fair market value that is determined by local assessors to be the total taxable value of land and additions on the property. | Land | Improvement |
|---|---|---|---|---|
| 2025 | $685 | $47,862 | $28,000 | $19,862 |
| 2024 | $665 | $47,862 | $28,000 | $19,862 |
| 2023 | $665 | $42,063 | $24,150 | $17,913 |
| 2022 | $646 | $38,437 | $22,400 | $16,037 |
| 2021 | $627 | $36,969 | $22,050 | $14,919 |
| 2020 | $580 | $36,556 | $22,050 | $14,506 |
| 2019 | $573 | $27,291 | $13,300 | $13,991 |
| 2018 | $546 | $25,369 | $12,250 | $13,119 |
| 2017 | $782 | $23,847 | $10,850 | $12,997 |
| 2016 | $513 | $21,328 | $8,750 | $12,578 |
| 2015 | $510 | $17,451 | $5,250 | $12,201 |
| 2014 | $495 | $17,138 | $5,250 | $11,888 |
Source: Public Records
Map
Nearby Homes
- 1901 Manhattan Dr
- 1604 Luning Dr
- 2100 Port Ave
- 2304 Shady Hill Ave
- 2045 Rose Coral Ave
- 2508 Ellingson Dr
- 1918 King Hill St
- 1928 King Hill St
- 1920 Hodgenville St Unit 103
- 1936 King Hill St
- 2525 Sierra Bello Ave Unit 103
- 2501 Charleville Ave Unit 104
- 1956 Vista Malaga St Unit 103
- 2621 Adelante Ave Unit 104
- 2621 Adelante Ave Unit 102
- 1310 N Tonopah Dr
- 2521 Sierra Luna Ave Unit 106
- 2203 Langdon Way
- 2520 Bottle Palm Ct
- 2624 Feather Cactus Ct
- 1805 Ludwig Dr
- 1800 Manhattan Dr
- 1717 Ludwig Dr
- 1804 Manhattan Dr
- 1809 Ludwig Dr
- 1800 Ludwig Dr
- 1716 Manhattan Dr
- 1804 Ludwig Dr
- 1713 Ludwig Dr
- 1813 Ludwig Dr
- 1716 Ludwig Dr
- 1808 Ludwig Dr
- 1712 Manhattan Dr
- 1812 Manhattan Dr
- 1712 Ludwig Dr
- 1709 Ludwig Dr
- 1817 Ludwig Dr
- 1801 Windy Gap St
- 1812 Ludwig Dr