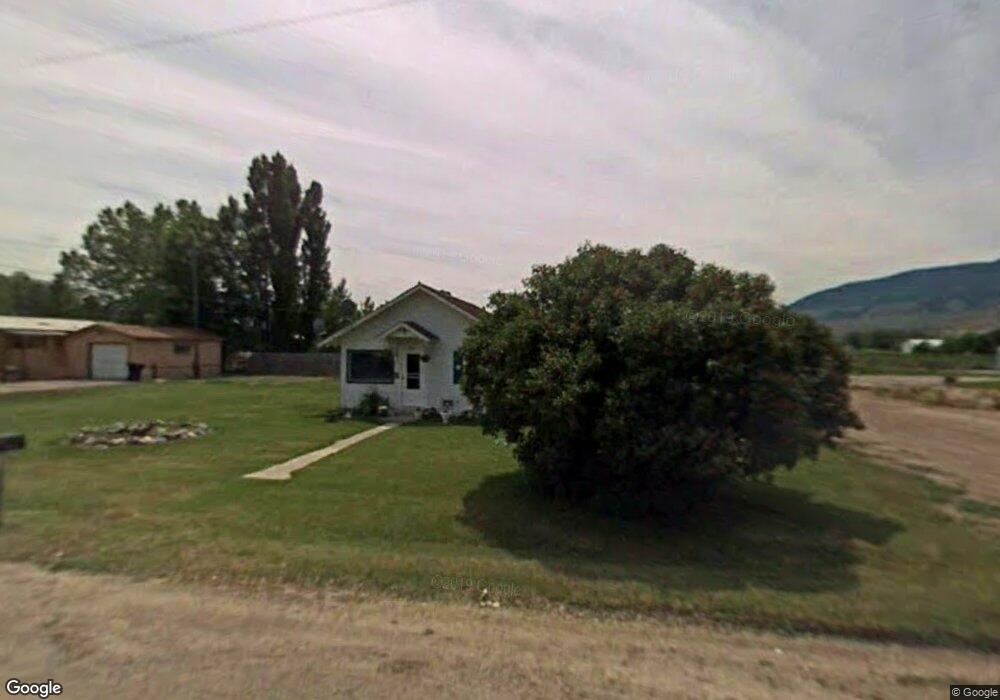
1801 Mary St Salmon, ID 83467
Estimated Value: $187,000 - $246,000
1
Bed
1
Bath
740
Sq Ft
$281/Sq Ft
Est. Value
About This Home
This home is located at 1801 Mary St, Salmon, ID 83467 and is currently estimated at $208,273, approximately $281 per square foot. 1801 Mary St is a home located in Lemhi County with nearby schools including Salmon Pioneer Primary School, Salmon Jr./Sr. High School, and Fern-Waters Public Charter School.
Ownership History
Date
Name
Owned For
Owner Type
Purchase Details
Closed on
Oct 14, 2022
Sold by
Erca Abby C
Bought by
Ace Revocable Living Trust
Current Estimated Value
Purchase Details
Closed on
Mar 16, 2010
Sold by
Malcolm Les E and Malcolm Jolene N
Bought by
Nelson Lisa L
Home Financials for this Owner
Home Financials are based on the most recent Mortgage that was taken out on this home.
Original Mortgage
$60,000
Interest Rate
4.93%
Mortgage Type
Seller Take Back
Create a Home Valuation Report for This Property
The Home Valuation Report is an in-depth analysis detailing your home's value as well as a comparison with similar homes in the area
Home Values in the Area
Average Home Value in this Area
Purchase History
| Date | Buyer | Sale Price | Title Company |
|---|---|---|---|
| Ace Revocable Living Trust | -- | -- | |
| Nelson Lisa L | -- | -- |
Source: Public Records
Mortgage History
| Date | Status | Borrower | Loan Amount |
|---|---|---|---|
| Previous Owner | Nelson Lisa L | $60,000 |
Source: Public Records
Tax History
| Year | Tax Paid | Tax Assessment Tax Assessment Total Assessment is a certain percentage of the fair market value that is determined by local assessors to be the total taxable value of land and additions on the property. | Land | Improvement |
|---|---|---|---|---|
| 2025 | $692 | $139,442 | $56,713 | $82,729 |
| 2024 | $634 | $139,442 | $56,713 | $82,729 |
| 2023 | $491 | $137,585 | $21,813 | $115,772 |
| 2022 | $595 | $137,585 | $21,813 | $115,772 |
| 2021 | $589 | $100,179 | $17,450 | $82,729 |
| 2020 | $371 | $54,050 | $12,651 | $41,399 |
| 2019 | $394 | $54,050 | $12,651 | $41,399 |
| 2018 | $401 | $54,078 | $20,940 | $33,138 |
| 2017 | $414 | $54,078 | $20,940 | $33,138 |
| 2016 | $433 | $54,078 | $20,940 | $33,138 |
| 2013 | $392 | $49,457 | $17,799 | $31,658 |
| 2011 | $392 | $51,014 | $14,833 | $36,181 |
Source: Public Records
Map
Nearby Homes
Your Personal Tour Guide
Ask me questions while you tour the home.