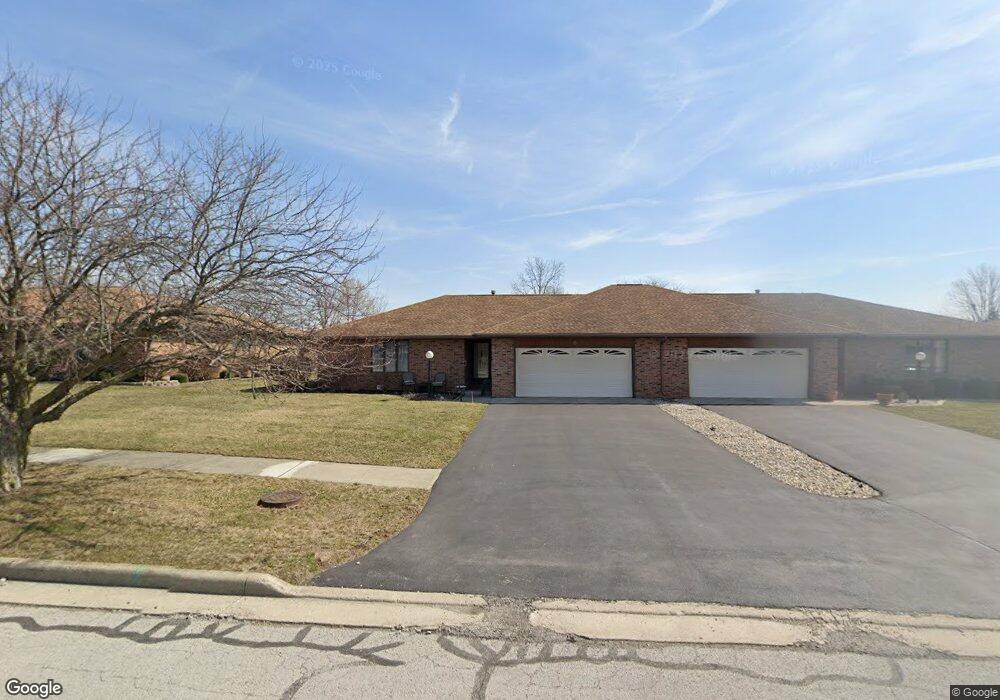
1801 Pebblestone Dr Unit 6 Findlay, OH 45840
Estimated Value: $266,000 - $289,000
3
Beds
2
Baths
1,964
Sq Ft
$142/Sq Ft
Est. Value
About This Home
This home is located at 1801 Pebblestone Dr Unit 6, Findlay, OH 45840 and is currently estimated at $278,672, approximately $141 per square foot. 1801 Pebblestone Dr Unit 6 is a home located in Hancock County with nearby schools including Wilson Vance Elementary School, Whittier Elementary School, and Glenwood Middle School.
Ownership History
Date
Name
Owned For
Owner Type
Purchase Details
Closed on
Apr 25, 2014
Sold by
Brandt Robert Edwin
Bought by
Brandt Judith Dillon
Current Estimated Value
Purchase Details
Closed on
Aug 22, 2011
Sold by
Tanaka Yoshiyuki and Tanaka Eri
Bought by
Brandt Robert Edwin and Brandt Judith Dillon
Purchase Details
Closed on
Aug 29, 2008
Sold by
Gill Donita M
Bought by
Tanaka Yoshiyuki and Tanaka Eri
Home Financials for this Owner
Home Financials are based on the most recent Mortgage that was taken out on this home.
Original Mortgage
$140,415
Interest Rate
6.66%
Mortgage Type
FHA
Purchase Details
Closed on
Jun 23, 1988
Bought by
Schmidt Dale R and Schmidt Helen L
Purchase Details
Closed on
Apr 15, 1988
Bought by
Petti Construction Co
Create a Home Valuation Report for This Property
The Home Valuation Report is an in-depth analysis detailing your home's value as well as a comparison with similar homes in the area
Home Values in the Area
Average Home Value in this Area
Purchase History
| Date | Buyer | Sale Price | Title Company |
|---|---|---|---|
| Brandt Judith Dillon | -- | Attorney | |
| Brandt Robert Edwin | $155,600 | None Available | |
| Tanaka Yoshiyuki | $175,000 | Assured Title | |
| Schmidt Dale R | $95,500 | -- | |
| Petti Construction Co | -- | -- |
Source: Public Records
Mortgage History
| Date | Status | Borrower | Loan Amount |
|---|---|---|---|
| Previous Owner | Tanaka Yoshiyuki | $140,415 |
Source: Public Records
Tax History Compared to Growth
Tax History
| Year | Tax Paid | Tax Assessment Tax Assessment Total Assessment is a certain percentage of the fair market value that is determined by local assessors to be the total taxable value of land and additions on the property. | Land | Improvement |
|---|---|---|---|---|
| 2024 | $1,968 | $65,190 | $3,680 | $61,510 |
| 2023 | $1,993 | $65,190 | $3,680 | $61,510 |
| 2022 | $2,001 | $65,190 | $3,680 | $61,510 |
| 2021 | $1,991 | $57,660 | $2,800 | $54,860 |
| 2020 | $1,990 | $57,660 | $2,800 | $54,860 |
| 2019 | $1,952 | $57,660 | $2,800 | $54,860 |
| 2018 | $1,814 | $50,500 | $2,800 | $47,700 |
| 2017 | $1,815 | $50,500 | $2,800 | $47,700 |
| 2016 | $1,793 | $50,500 | $2,800 | $47,700 |
| 2015 | $1,757 | $48,930 | $2,800 | $46,130 |
| 2014 | $1,757 | $48,930 | $2,800 | $46,130 |
| 2012 | $2,514 | $57,070 | $2,800 | $54,270 |
Source: Public Records
Map
Nearby Homes
- 2024 Silverstone Dr
- 1457 Eastshore Dr
- 1309 Chateau Cir Unit 63
- 1306 Chateau Cir Unit 62
- 1306 Chateau Cir Unit 55
- 1306 Chateau Cir Unit 61
- 1364 Chateau Cir Unit 26
- 1364 Chateau Cir Unit 31
- 0 Bright Rd Unit 6117142
- 0 Bright Rd Unit 6117138
- 0 Bright Rd Unit 6117143
- 0 Bright Rd Unit 6117148
- 1203 Chateau Ct
- 1854 Huntington Dr
- 838 Longmeadow Ln
- 822 Bright Rd
- 0 Romick Pkwy Unit 6096049
- 0 Romick Pkwy Unit 6131435
- 0 Romick Pkwy Unit 6123797
- 1932 Queenswood Dr
- 1721 Pebblestone Dr
- 1807 Pebblestone Dr
- 1811 Pebblestone Dr
- 1715 Pebblestone Dr
- 1800 Pebblestone Dr
- 1711 Pebblestone Dr
- 1720 Pebblestone Dr
- 1806 Pebblestone Dr
- 1810 Pebblestone Dr Unit 8
- 1820 Stonehill Dr
- 1714 Pebblestone Dr
- 1710 Pebblestone Dr
- 1817 Pebblestone Dr Unit U9
- 1720 Stonehill Dr
- 1806 Stonehill Dr
- 1800 Stonehill Dr
- 1821 Pebblestone Dr
- 1810 Stonehill Dr
- 1705 Pebblestone Dr
- 1816 Pebblestone Dr