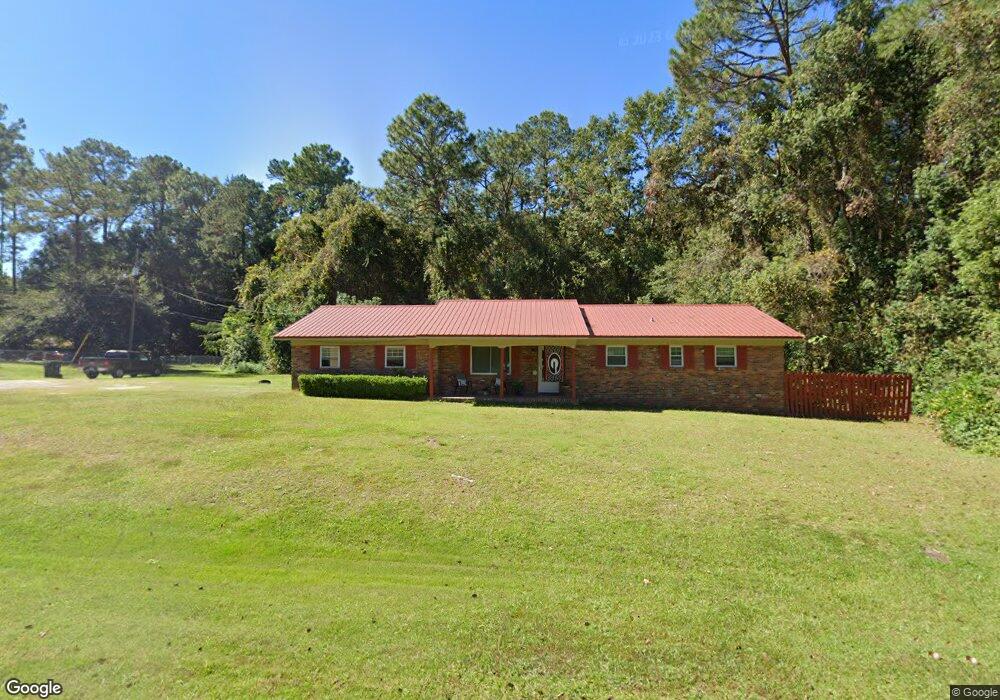
1801 Riverside Ave Waycross, GA 31501
Estimated Value: $145,162 - $166,000
3
Beds
2
Baths
1,588
Sq Ft
$99/Sq Ft
Est. Value
About This Home
This home is located at 1801 Riverside Ave, Waycross, GA 31501 and is currently estimated at $157,291, approximately $99 per square foot. 1801 Riverside Ave is a home located in Ware County with nearby schools including Center Elementary School, Waycross Middle School, and Ware County High School.
Ownership History
Date
Name
Owned For
Owner Type
Purchase Details
Closed on
Apr 24, 2019
Sold by
American Advisors Grp
Bought by
Gap Property Llc
Current Estimated Value
Home Financials for this Owner
Home Financials are based on the most recent Mortgage that was taken out on this home.
Original Mortgage
$60,000
Interest Rate
4%
Mortgage Type
New Conventional
Purchase Details
Closed on
Apr 3, 2018
Sold by
Armstrong Lorena
Bought by
American Advisors Grp
Purchase Details
Closed on
Oct 31, 2016
Sold by
Lorena
Bought by
Armstrong Willie Adrian and Armstrong Paulette
Purchase Details
Closed on
Aug 12, 2013
Sold by
Armstrong Lorena P
Bought by
Boone Loretta and Armstrong Adrian
Home Financials for this Owner
Home Financials are based on the most recent Mortgage that was taken out on this home.
Original Mortgage
$105,000
Interest Rate
2.94%
Mortgage Type
Reverse Mortgage Home Equity Conversion Mortgage
Purchase Details
Closed on
Apr 17, 1997
Sold by
Boone Loretta and Boone Illi
Bought by
Armstrong Lorena
Create a Home Valuation Report for This Property
The Home Valuation Report is an in-depth analysis detailing your home's value as well as a comparison with similar homes in the area
Home Values in the Area
Average Home Value in this Area
Purchase History
| Date | Buyer | Sale Price | Title Company |
|---|---|---|---|
| Gap Property Llc | $37,250 | -- | |
| American Advisors Grp | $52,000 | -- | |
| Armstrong Willie Adrian | -- | -- | |
| Boone Loretta | -- | -- | |
| Armstrong Lorena | -- | -- |
Source: Public Records
Mortgage History
| Date | Status | Borrower | Loan Amount |
|---|---|---|---|
| Closed | Gap Property Llc | $60,000 | |
| Previous Owner | Boone Loretta | $105,000 |
Source: Public Records
Tax History Compared to Growth
Tax History
| Year | Tax Paid | Tax Assessment Tax Assessment Total Assessment is a certain percentage of the fair market value that is determined by local assessors to be the total taxable value of land and additions on the property. | Land | Improvement |
|---|---|---|---|---|
| 2024 | $2,000 | $55,347 | $2,720 | $52,627 |
| 2023 | $1,717 | $25,941 | $1,830 | $24,111 |
| 2022 | $1,034 | $25,941 | $1,830 | $24,111 |
| 2021 | $1,003 | $23,202 | $1,830 | $21,372 |
| 2020 | $995 | $22,822 | $1,830 | $20,992 |
| 2019 | $984 | $22,253 | $1,830 | $20,423 |
| 2018 | $38 | $21,304 | $1,830 | $19,474 |
| 2017 | $180 | $26,458 | $1,830 | $24,628 |
| 2016 | $180 | $26,458 | $1,830 | $24,628 |
| 2015 | $181 | $26,457 | $1,830 | $24,628 |
| 2014 | $181 | $26,458 | $1,830 | $24,628 |
| 2013 | -- | $29,000 | $1,829 | $27,171 |
Source: Public Records
Map
Nearby Homes
- 1301 Riverside Ave
- 515 Summit St
- 1408 Bethune St
- 904 Golfview Dr
- 0 Beville St
- 2312 Spurgeon St
- 705 E Waring St
- 1410 Hazel St
- 2120 Tebeau St
- 1407 Hazel St
- 1219 Clough St
- 2123 Sunnyside Dr
- 2022 Pioneer St
- 1013 E Waring St
- 2509 Tebeau St
- 607 Linden Dr
- 2202 Pioneer St
- 220 E Blackshear Ave
- 00 Pineview Dr
- 0 Pineview Dr