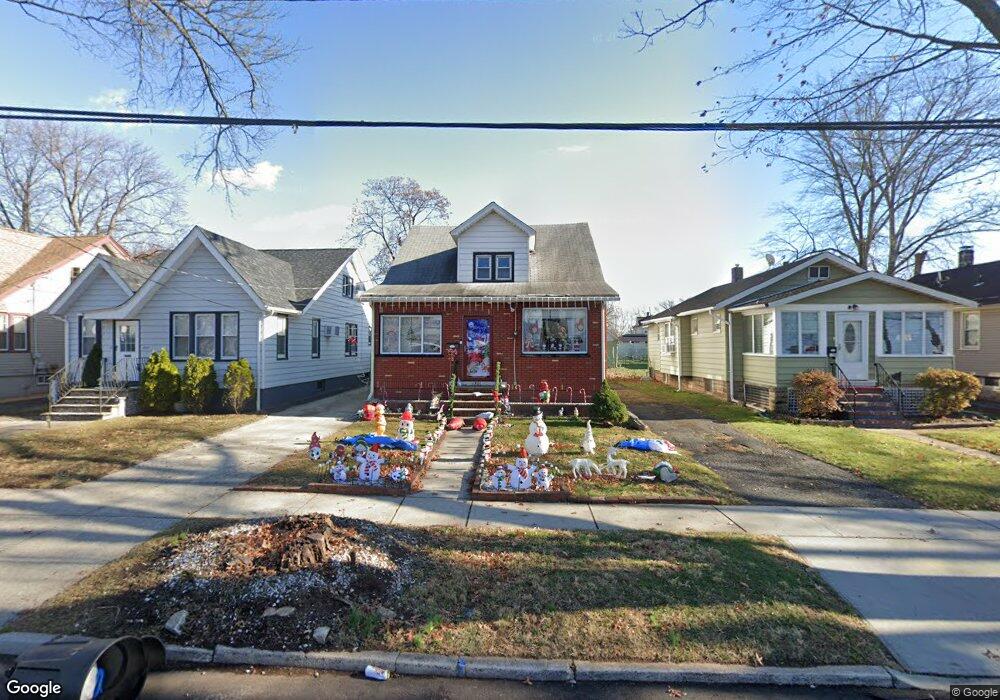
1801 Rutherford St Rahway, NJ 07065
Estimated Value: $485,000 - $581,000
3
Beds
2
Baths
1,444
Sq Ft
$358/Sq Ft
Est. Value
About This Home
This home is located at 1801 Rutherford St, Rahway, NJ 07065 and is currently estimated at $516,773, approximately $357 per square foot. 1801 Rutherford St is a home located in Union County with nearby schools including Rahway High School.
Ownership History
Date
Name
Owned For
Owner Type
Purchase Details
Closed on
Nov 15, 2017
Sold by
Secretary Of Housing And Urban Developme
Bought by
Crespo Marisol
Current Estimated Value
Home Financials for this Owner
Home Financials are based on the most recent Mortgage that was taken out on this home.
Original Mortgage
$185,552
Outstanding Balance
$155,071
Interest Rate
3.75%
Mortgage Type
FHA
Estimated Equity
$361,702
Purchase Details
Closed on
Jan 24, 2017
Sold by
Pennymac Loan Services Llc
Bought by
Secretar Of Housing And Urban Developme
Purchase Details
Closed on
Aug 23, 2016
Sold by
Union County Sheriff
Bought by
Pennymac Loan Services Llc
Purchase Details
Closed on
Jul 5, 2005
Sold by
Eugenny Kirby
Bought by
Gonzalez Marisol
Home Financials for this Owner
Home Financials are based on the most recent Mortgage that was taken out on this home.
Original Mortgage
$260,800
Interest Rate
5.59%
Mortgage Type
New Conventional
Create a Home Valuation Report for This Property
The Home Valuation Report is an in-depth analysis detailing your home's value as well as a comparison with similar homes in the area
Home Values in the Area
Average Home Value in this Area
Purchase History
| Date | Buyer | Sale Price | Title Company |
|---|---|---|---|
| Crespo Marisol | $170,001 | None Available | |
| Secretar Of Housing And Urban Developme | -- | None Available | |
| Pennymac Loan Services Llc | $1,000 | -- | |
| Gonzalez Marisol | $267,000 | -- |
Source: Public Records
Mortgage History
| Date | Status | Borrower | Loan Amount |
|---|---|---|---|
| Open | Crespo Marisol | $185,552 | |
| Previous Owner | Gonzalez Marisol | $260,800 |
Source: Public Records
Tax History Compared to Growth
Tax History
| Year | Tax Paid | Tax Assessment Tax Assessment Total Assessment is a certain percentage of the fair market value that is determined by local assessors to be the total taxable value of land and additions on the property. | Land | Improvement |
|---|---|---|---|---|
| 2025 | $8,760 | $118,300 | $40,200 | $78,100 |
| 2024 | $8,484 | $118,300 | $40,200 | $78,100 |
| 2023 | $8,484 | $118,300 | $40,200 | $78,100 |
| 2022 | $8,307 | $118,300 | $40,200 | $78,100 |
| 2021 | $8,223 | $118,300 | $40,200 | $78,100 |
| 2020 | $8,192 | $118,300 | $40,200 | $78,100 |
| 2019 | $7,733 | $113,100 | $40,200 | $72,900 |
| 2018 | $7,570 | $113,100 | $40,200 | $72,900 |
| 2017 | $7,383 | $113,100 | $40,200 | $72,900 |
| 2016 | $7,226 | $113,100 | $40,200 | $72,900 |
| 2015 | $7,145 | $113,100 | $40,200 | $72,900 |
| 2014 | $7,017 | $113,100 | $40,200 | $72,900 |
Source: Public Records
Map
Nearby Homes
- 1860 Paterson St
- 566 E Milton Ave Unit 1
- 1922 Barnett St Unit 24
- 716 E Grand Ave Unit 4
- 716 E Grand Ave Unit 18
- 420-22 E Milton Ave
- 1435 Barnhardt Ln Unit 604
- 1427 Barnhardt Ln Unit 502
- 36 E Grand Ave Unit 27
- 735 E Hazelwood Ave
- 1330 Stockton St
- 1 Carriage City Plaza Unit 1502
- 1 Carriage City Plaza Unit 613
- 1 Carriage City Plaza Unit 1212
- 1 Carriage City Plaza Unit 503
- 91 Elm Ave
- 2012 Price St
- 173 W Main St Unit 7
- 245 William St
- 280 E Hazelwood Ave
- 1795 Rutherford St
- 1807 Rutherford St
- 1813 Rutherford St
- 1791 Rutherford St
- 1785 Rutherford St
- 1819 Rutherford St
- 1779 Rutherford St
- 1848 Paterson St
- 1825 Rutherford St
- 1842 Paterson St
- 1852 Paterson St
- 505 Washington St
- 511 Washington St
- 1832 Paterson St
- 1829 Rutherford St
- 1773 Rutherford St
- 517 Washington St
- 1826 Paterson St
- 1794 Rutherford St
- 1788 Rutherford St