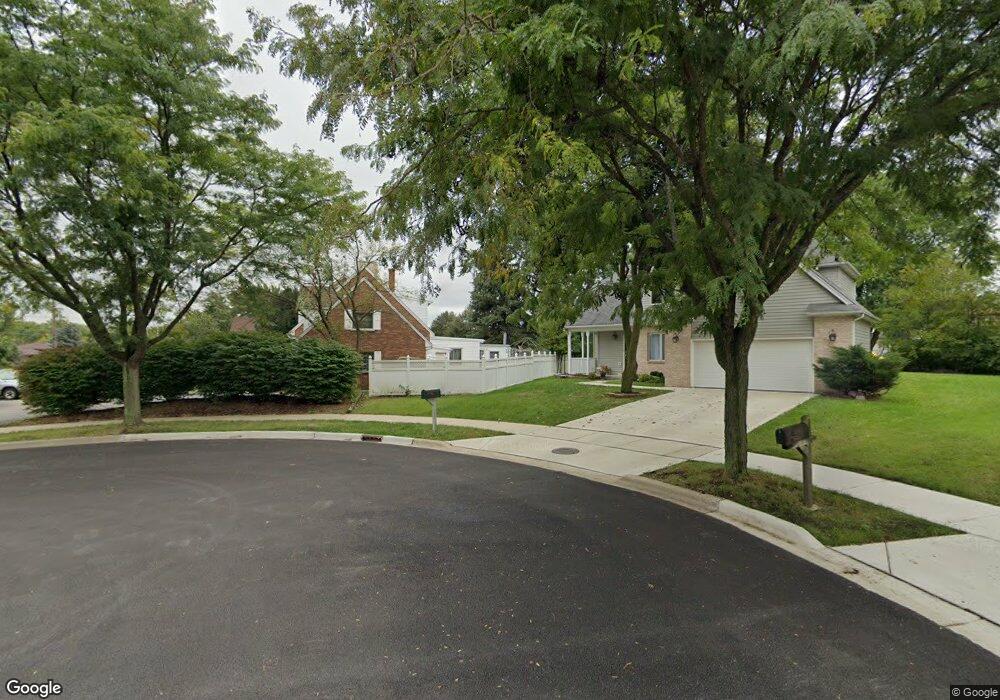
1801 W Carriage Ct Addison, IL 60101
Estimated Value: $387,000 - $505,000
3
Beds
2
Baths
1,684
Sq Ft
$250/Sq Ft
Est. Value
About This Home
This home is located at 1801 W Carriage Ct, Addison, IL 60101 and is currently estimated at $420,309, approximately $249 per square foot. 1801 W Carriage Ct is a home located in DuPage County with nearby schools including Stone Elementary School, Indian Trail Jr High School, and Addison Trail High School.
Ownership History
Date
Name
Owned For
Owner Type
Purchase Details
Closed on
Jun 25, 2001
Sold by
Sapnu Jolly
Bought by
Sapnu Lea
Current Estimated Value
Home Financials for this Owner
Home Financials are based on the most recent Mortgage that was taken out on this home.
Original Mortgage
$147,000
Interest Rate
7.2%
Purchase Details
Closed on
Apr 24, 1996
Sold by
Sapnu Elizabeth and Sapnu Lea
Bought by
Sapnu Lea and Sapnu Jolly
Home Financials for this Owner
Home Financials are based on the most recent Mortgage that was taken out on this home.
Original Mortgage
$146,484
Interest Rate
7.86%
Mortgage Type
FHA
Purchase Details
Closed on
May 30, 1995
Sold by
Caputo Michael A and Caputo Sharon L
Bought by
Sapnu Lea and Sapnu Elizabeth
Home Financials for this Owner
Home Financials are based on the most recent Mortgage that was taken out on this home.
Original Mortgage
$141,002
Interest Rate
8.27%
Mortgage Type
FHA
Create a Home Valuation Report for This Property
The Home Valuation Report is an in-depth analysis detailing your home's value as well as a comparison with similar homes in the area
Home Values in the Area
Average Home Value in this Area
Purchase History
| Date | Buyer | Sale Price | Title Company |
|---|---|---|---|
| Sapnu Lea | -- | Chicago Title Insurance Co | |
| Sapnu Lea | -- | Chicago Title Insurance Co | |
| Sapnu Lea | $144,000 | Chicago Title Insurance Co |
Source: Public Records
Mortgage History
| Date | Status | Borrower | Loan Amount |
|---|---|---|---|
| Closed | Sapnu Lea | $147,000 | |
| Closed | Sapnu Lea | $146,484 | |
| Closed | Sapnu Lea | $141,002 |
Source: Public Records
Tax History Compared to Growth
Tax History
| Year | Tax Paid | Tax Assessment Tax Assessment Total Assessment is a certain percentage of the fair market value that is determined by local assessors to be the total taxable value of land and additions on the property. | Land | Improvement |
|---|---|---|---|---|
| 2024 | $6,322 | $98,163 | $29,021 | $69,142 |
| 2023 | $5,988 | $89,770 | $26,540 | $63,230 |
| 2022 | $5,819 | $84,940 | $26,370 | $58,570 |
| 2021 | $5,523 | $80,700 | $25,050 | $55,650 |
| 2020 | $5,470 | $78,730 | $24,440 | $54,290 |
| 2019 | $5,442 | $75,660 | $23,490 | $52,170 |
| 2018 | $4,913 | $66,310 | $20,590 | $45,720 |
| 2017 | $4,627 | $61,460 | $19,080 | $42,380 |
| 2016 | $7,026 | $85,600 | $26,580 | $59,020 |
| 2015 | $6,928 | $79,880 | $24,800 | $55,080 |
| 2014 | $6,693 | $76,810 | $23,850 | $52,960 |
| 2013 | $6,654 | $79,440 | $24,670 | $54,770 |
Source: Public Records
Map
Nearby Homes
- 1750 W Woodland Ave
- 1711 W Woodland Ave
- 522 N Castle Rd
- 823 N Cambridge Row
- 1795 W Jo Ann Ln
- 1741 W Goldengate Dr Unit 2
- 1701 W Goldengate Dr
- 802 N Tamarac Blvd Unit Z5
- 865 N Tamarac Blvd
- 943 N Rohlwing Rd Unit 101H
- 953 N Rohlwing Rd Unit GB
- 953 N Rohlwing Rd Unit 201A
- 1560 W Goldengate Dr
- 1801 W Army Trail Rd
- 20W561 Army Trail Blvd
- 881 N Swift Rd Unit 306
- 881 N Swift Rd Unit 106
- 941 N Swift Rd Unit 301
- 580 N Highlander Way
- 1313 W Byron Ave
- 1807 W Carriage Ct
- 618 N Rohlwing Rd
- 616 N Rohlwing Rd
- 1810 W Carriage Ct
- 614 N Rohlwing Rd
- 1800 W Carriage Ct
- 1806 W Carriage Ct
- 627 N Rumple Ln
- 631 N Rumple Ln
- 635 N Rumple Ln
- 623 N Rumple Ln
- 639 N Rumple Ln
- 619 N Rumple Ln
- 710 N Rohlwing Rd
- 1788 W Whispering Ct
- 1800 W Woodland Ave
- 615 N Rumple Ln
- 1804 W Woodland Ave
- 701 N Rumple Ln
- 1789 W Whispering Ct