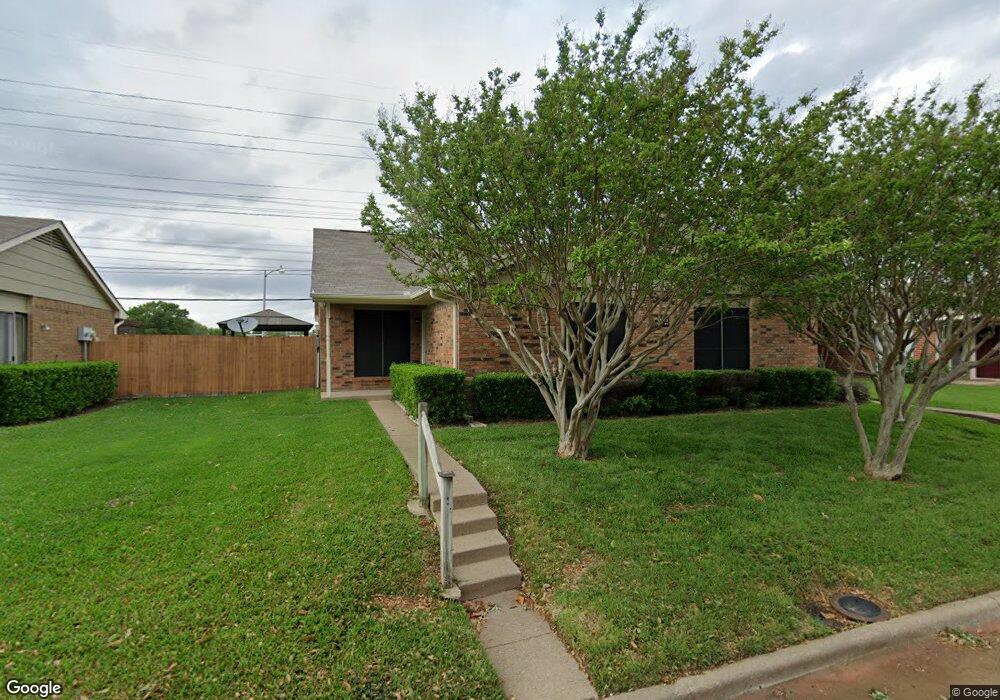
1801 W Spring Creek Pkwy Unit 1 Plano, TX 75023
Park Forest NeighborhoodEstimated Value: $214,824 - $241,000
--
Bed
--
Bath
1,030
Sq Ft
$221/Sq Ft
Est. Value
About This Home
This home is located at 1801 W Spring Creek Pkwy Unit 1, Plano, TX 75023 and is currently estimated at $227,206, approximately $220 per square foot. 1801 W Spring Creek Pkwy Unit 1 is a home located in Collin County with nearby schools including Thomas Elementary School, Carpenter Middle School, and Clark High School.
Ownership History
Date
Name
Owned For
Owner Type
Purchase Details
Closed on
Jul 8, 2016
Sold by
Elahi Mojtaba
Bought by
Arshia Real Estate Llc
Current Estimated Value
Purchase Details
Closed on
May 30, 2014
Sold by
Cross Katrina A and Johnson Terry
Bought by
Elahi Mojtaba
Purchase Details
Closed on
Mar 23, 2007
Sold by
Bennett Rodger Prince
Bought by
Cross Katrina A
Home Financials for this Owner
Home Financials are based on the most recent Mortgage that was taken out on this home.
Original Mortgage
$83,588
Interest Rate
6.3%
Mortgage Type
Purchase Money Mortgage
Purchase Details
Closed on
May 21, 1997
Sold by
Armstrong Cynthia L and Snyder Cynthia
Bought by
Bennett Rodger Prince
Home Financials for this Owner
Home Financials are based on the most recent Mortgage that was taken out on this home.
Original Mortgage
$58,400
Interest Rate
8.17%
Mortgage Type
Purchase Money Mortgage
Create a Home Valuation Report for This Property
The Home Valuation Report is an in-depth analysis detailing your home's value as well as a comparison with similar homes in the area
Home Values in the Area
Average Home Value in this Area
Purchase History
| Date | Buyer | Sale Price | Title Company |
|---|---|---|---|
| Arshia Real Estate Llc | -- | None Available | |
| Elahi Mojtaba | -- | None Available | |
| Cross Katrina A | -- | None Available | |
| Bennett Rodger Prince | -- | -- |
Source: Public Records
Mortgage History
| Date | Status | Borrower | Loan Amount |
|---|---|---|---|
| Previous Owner | Cross Katrina A | $83,588 | |
| Previous Owner | Bennett Rodger Prince | $58,400 |
Source: Public Records
Tax History Compared to Growth
Tax History
| Year | Tax Paid | Tax Assessment Tax Assessment Total Assessment is a certain percentage of the fair market value that is determined by local assessors to be the total taxable value of land and additions on the property. | Land | Improvement |
|---|---|---|---|---|
| 2025 | $3,702 | $204,190 | $59,280 | $144,910 |
| 2024 | $3,702 | $234,490 | $59,280 | $159,720 |
| 2023 | $3,702 | $215,119 | $54,340 | $160,779 |
| 2022 | $3,792 | $198,436 | $57,200 | $141,236 |
| 2021 | $3,677 | $182,329 | $41,600 | $140,729 |
| 2020 | $3,416 | $167,304 | $41,600 | $125,704 |
| 2019 | $3,254 | $150,545 | $41,600 | $108,945 |
| 2018 | $3,386 | $155,340 | $41,600 | $113,740 |
| 2017 | $3,196 | $146,648 | $31,200 | $115,448 |
| 2016 | $2,559 | $115,924 | $24,960 | $90,964 |
| 2015 | $1,886 | $98,112 | $18,720 | $79,392 |
Source: Public Records
Map
Nearby Homes
- 1801 W Spring Creek Pkwy Unit 1
- 1609 California Trail
- 1614 Cherokee Trail
- 6000 Blue Ridge Trail
- 6508 Ember Ct
- 6509 Palmer Trail
- 2008 Apple Valley Rd
- 6517 Mesquite Trail
- 1525 California Trail
- 1629 Mesquite Trail
- 6541 Santa fe Trail
- 6525 Osage Trail
- 1517 W Spring Creek Pkwy
- 5004 Green Oaks Dr
- 1917 Sparrows Point Dr
- 1506 W Spring Creek Pkwy
- 1613 Cumberland Trail
- 1604 Stockton Trail
- 1433 Coffeyville Trail
- 1425 Coffeyville Trail
- 1801 W Spring Creek Pkwy Unit O1
- 1801 W Spring Creek Pkwy Unit M01
- 1801 W Spring Creek Pkwy Unit V2
- 1801 W Spring Creek Pkwy Unit H1
- 1801 W Spring Creek Pkwy Unit 2
- 1801 W Spring Creek Pkwy Unit 2
- 1801 W Spring Creek Pkwy Unit 1
- 1801 W Spring Creek Pkwy Unit 2
- 1801 W Spring Creek Pkwy Unit 2
- 1801 W Spring Creek Pkwy Unit 1
- 1801 W Spring Creek Pkwy Unit 1
- 1801 W Spring Creek Pkwy Unit 2
- 1801 W Spring Creek Pkwy Unit 2
- 1801 W Spring Creek Pkwy Unit 2
- 1801 W Spring Creek Pkwy Unit 2
- 1801 W Spring Creek Pkwy Unit 2
- 1801 W Spring Creek Pkwy Unit 1
- 1801 W Spring Creek Pkwy Unit 1
- 1801 W Spring Creek Pkwy Unit 2
- 1801 W Spring Creek Pkwy Unit 1