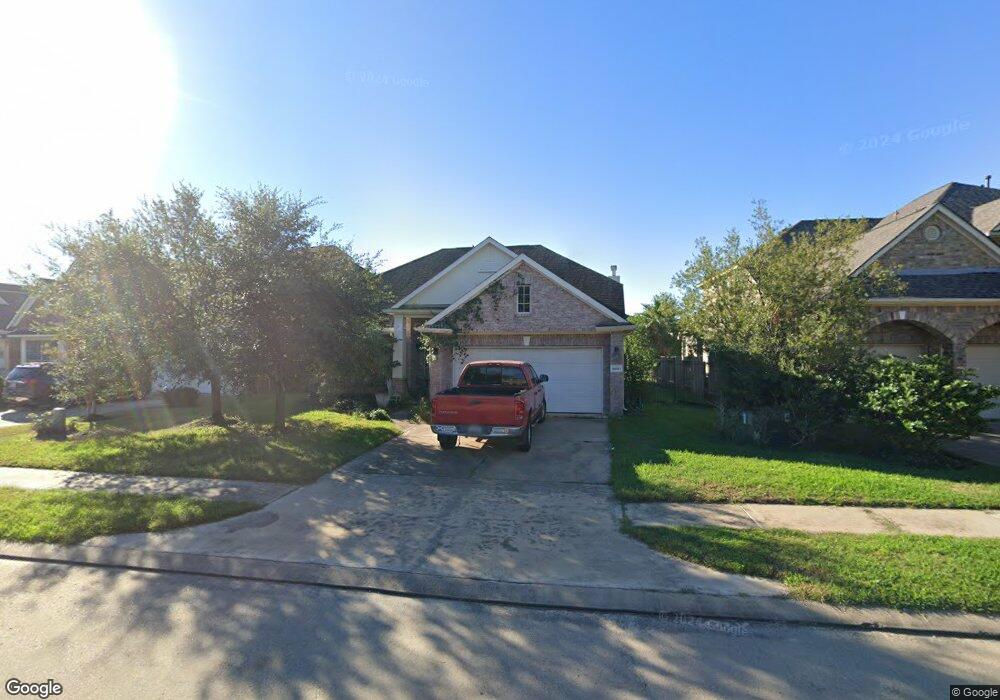
18011 Billabong Crescent Ct Cypress, TX 77429
Estimated Value: $356,000 - $404,000
3
Beds
2
Baths
2,084
Sq Ft
$177/Sq Ft
Est. Value
About This Home
This home is located at 18011 Billabong Crescent Ct, Cypress, TX 77429 and is currently estimated at $369,617, approximately $177 per square foot. 18011 Billabong Crescent Ct is a home located in Harris County with nearby schools including Farney Elementary School, Goodson Middle, and Cypress Woods High School.
Ownership History
Date
Name
Owned For
Owner Type
Purchase Details
Closed on
Aug 22, 2014
Sold by
Mccrindle James D
Bought by
Mccrindle James D
Current Estimated Value
Home Financials for this Owner
Home Financials are based on the most recent Mortgage that was taken out on this home.
Original Mortgage
$120,000
Interest Rate
4.15%
Mortgage Type
New Conventional
Purchase Details
Closed on
Feb 27, 2009
Sold by
Whitehead Christopher and Whitehead Erica
Bought by
Mccrindle James D
Home Financials for this Owner
Home Financials are based on the most recent Mortgage that was taken out on this home.
Original Mortgage
$159,300
Interest Rate
5.13%
Mortgage Type
Purchase Money Mortgage
Purchase Details
Closed on
Oct 26, 2006
Sold by
Castlerock Communities Lp
Bought by
Whitehead Christopher and Whitehead Erica
Home Financials for this Owner
Home Financials are based on the most recent Mortgage that was taken out on this home.
Original Mortgage
$185,143
Interest Rate
6.41%
Mortgage Type
Purchase Money Mortgage
Create a Home Valuation Report for This Property
The Home Valuation Report is an in-depth analysis detailing your home's value as well as a comparison with similar homes in the area
Home Values in the Area
Average Home Value in this Area
Purchase History
| Date | Buyer | Sale Price | Title Company |
|---|---|---|---|
| Mccrindle James D | -- | First American Title Ins Co | |
| Mccrindle James D | -- | Stewart Title Houston Div | |
| Whitehead Christopher | -- | Stewart Title Houston Div |
Source: Public Records
Mortgage History
| Date | Status | Borrower | Loan Amount |
|---|---|---|---|
| Closed | Mccrindle James D | $120,000 | |
| Closed | Mccrindle James D | $159,300 | |
| Previous Owner | Whitehead Christopher | $185,143 |
Source: Public Records
Tax History Compared to Growth
Tax History
| Year | Tax Paid | Tax Assessment Tax Assessment Total Assessment is a certain percentage of the fair market value that is determined by local assessors to be the total taxable value of land and additions on the property. | Land | Improvement |
|---|---|---|---|---|
| 2025 | $3,850 | $405,262 | $88,067 | $317,195 |
| 2024 | $3,850 | $367,155 | $88,067 | $279,088 |
| 2023 | $3,850 | $395,024 | $88,067 | $306,957 |
| 2022 | $7,784 | $360,464 | $76,571 | $283,893 |
| 2021 | $7,549 | $273,426 | $76,571 | $196,855 |
| 2020 | $7,962 | $276,991 | $76,571 | $200,420 |
| 2019 | $7,763 | $260,000 | $76,571 | $183,429 |
| 2018 | $2,398 | $239,452 | $76,571 | $162,881 |
| 2017 | $8,026 | $266,965 | $76,571 | $190,394 |
| 2016 | $7,791 | $273,224 | $60,694 | $212,530 |
| 2015 | $5,552 | $261,284 | $60,694 | $200,590 |
| 2014 | $5,552 | $240,137 | $60,694 | $179,443 |
Source: Public Records
Map
Nearby Homes
- 18006 Cypress Valley Ln
- 17910 Cypress Valley Ln
- 18103 Double Bay Rd
- 17922 Harbour Bridge Point Dr
- 17931 Sugarloaf Bay Dr
- 14803 Opera House Row Dr
- 18103 Blues Point Dr
- 14727 Arbor Trace Ct
- 17926 Sugarloaf Bay Dr
- 15026 Magnoliabough Place
- 14639 Cypress Cottage Ct
- 15011 Magnoliabough Place
- 14706 Emerald Cypress Ln
- 18306 Juniper Creek Ln
- 17515 Cypress Orchard Ln
- 18318 Maple Mill Dr
- 17631 Huffmeister Rd
- 17859 Camp Cove Dr
- 18214 Cobblestone Dr
- 17862 Camp Cove Dr
- 18007 Billabong Crescent Ct
- 18019 Billabong Crescent Ct
- 18023 Billabong Crescent Ct
- 18003 Billabong Crescent Ct
- 18027 Billabong Crescent Ct
- 18010 Billabong Crescent Ct
- 18014 Billabong Crescent Ct
- 18006 Billabong Crescent Ct
- 18018 Billabong Crescent Ct
- 18022 Billabong Crescent Ct
- 18002 Billabong Crescent Ct
- 18031 Billabong Crescent Ct
- 18006 Dunoon Bay Point Ct
- 18002 Dunoon Bay Point Ct
- 18026 Billabong Crescent Ct
- 18035 Billabong Crescent Ct
- 14835 Elizabeth Bay Rd
- 14839 Elizabeth Bay Rd
- 18022 Dunoon Bay Point Ct
- 18030 Billabong Crescent Ct