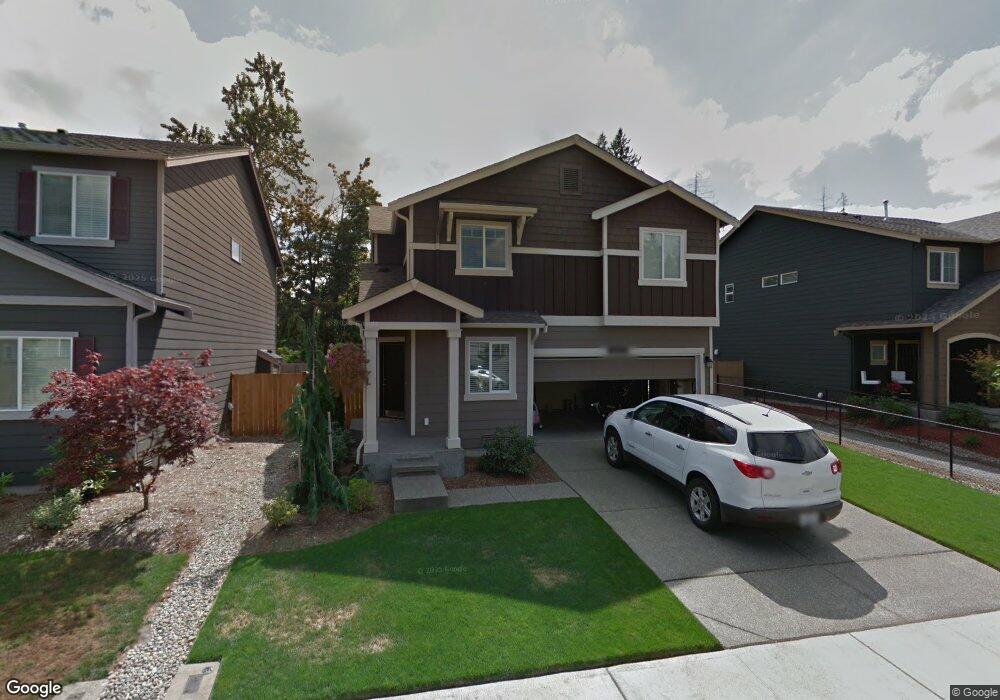
18018 111th St E Unit 32 Bonney Lake, WA 98391
Estimated Value: $551,046 - $631,000
4
Beds
3
Baths
1,764
Sq Ft
$335/Sq Ft
Est. Value
About This Home
This home is located at 18018 111th St E Unit 32, Bonney Lake, WA 98391 and is currently estimated at $590,262, approximately $334 per square foot. 18018 111th St E Unit 32 is a home located in Pierce County with nearby schools including Donald Eismann Elementary School, Sumner Middle School, and Bonney Lake High School.
Ownership History
Date
Name
Owned For
Owner Type
Purchase Details
Closed on
Sep 30, 2015
Sold by
Rusher Eric E and Rusher Maria
Bought by
Witters Austin
Current Estimated Value
Home Financials for this Owner
Home Financials are based on the most recent Mortgage that was taken out on this home.
Original Mortgage
$274,900
Outstanding Balance
$215,552
Interest Rate
3.78%
Mortgage Type
VA
Estimated Equity
$374,710
Purchase Details
Closed on
Nov 16, 2010
Sold by
Sshi Llc
Bought by
Rusher Eric Eugene and Rusher Maria
Home Financials for this Owner
Home Financials are based on the most recent Mortgage that was taken out on this home.
Original Mortgage
$224,865
Interest Rate
4.23%
Mortgage Type
New Conventional
Purchase Details
Closed on
Dec 4, 2009
Sold by
Rainier Pacific Bank
Bought by
Sshi Llc and Dr Horton
Purchase Details
Closed on
Sep 8, 2009
Sold by
Boardwalk Homes Inc
Bought by
Rainier Pacific Bank
Create a Home Valuation Report for This Property
The Home Valuation Report is an in-depth analysis detailing your home's value as well as a comparison with similar homes in the area
Home Values in the Area
Average Home Value in this Area
Purchase History
| Date | Buyer | Sale Price | Title Company |
|---|---|---|---|
| Witters Austin | $274,619 | Stewart Title Company | |
| Rusher Eric Eugene | $216,994 | Chicago Title Insurance Co | |
| Sshi Llc | $1,871,200 | First American Title Insuran | |
| Rainier Pacific Bank | $5,000,000 | Fatco |
Source: Public Records
Mortgage History
| Date | Status | Borrower | Loan Amount |
|---|---|---|---|
| Open | Witters Austin | $274,900 | |
| Previous Owner | Rusher Eric Eugene | $224,865 |
Source: Public Records
Tax History Compared to Growth
Tax History
| Year | Tax Paid | Tax Assessment Tax Assessment Total Assessment is a certain percentage of the fair market value that is determined by local assessors to be the total taxable value of land and additions on the property. | Land | Improvement |
|---|---|---|---|---|
| 2025 | $4,663 | $509,300 | $192,700 | $316,600 |
| 2024 | $4,663 | $486,200 | $189,300 | $296,900 |
| 2023 | $4,663 | $458,400 | $182,400 | $276,000 |
| 2022 | $4,652 | $469,100 | $194,400 | $274,700 |
| 2021 | $4,432 | $340,200 | $117,500 | $222,700 |
| 2019 | $3,772 | $324,100 | $102,700 | $221,400 |
| 2018 | $3,652 | $305,900 | $97,400 | $208,500 |
| 2017 | $3,303 | $260,500 | $78,400 | $182,100 |
| 2016 | $2,863 | $217,700 | $54,000 | $163,700 |
| 2014 | $2,688 | $202,400 | $51,200 | $151,200 |
| 2013 | $2,688 | $184,200 | $42,800 | $141,400 |
Source: Public Records
Map
Nearby Homes
- 17904 Panorama Blvd E
- 17926 113th St E
- 11005 184th Ave E
- 18110 114th St E
- 18402 109th Street Ct E
- 17604 Panorama Blvd E
- 10602 177th Avenue Ct E
- 17602 110th Street Ct E
- 10703 185th Ave E
- 11602 178th Place E
- 10705 176th Ave E
- 18408 106th St E
- 18312 104th Street Ct E
- 10405 176th Ave E
- 10202 184th Ave E
- 10801 171st Ave E
- 18306 101st St E
- 10208 174th Ave E
- 11601 188th Avenue Ct E
- 17012 W Hill Dr E
- 18018 111th St E
- 18022 111th St E
- 18022 111th St E Unit 31
- 18014 111th St E
- 18104 111th St E
- 18104 111th St E Unit 30
- 18010 111th St E
- 18010 111th St E Unit 34
- 11021 180th Avenue Ct E
- 11021 180th Av Ct E
- 18108 111th St E
- 18006 111th St E
- 11022 180th Avenue Ct E
- 11017 180th Avenue Ct E
- 18112 111th St E
- 18002 111th St E
- 11018 180th Avenue Ct E
- 11024 181st Avenue Ct E
- 11013 180th Avenue Ct E
- 11013 180th Av Ct E