
Seller's Agent in 2013
Ki Kim
The Preview Group
(206) 334-2008
10 Total Sales

Estimated Value: $857,000 - $1,036,000
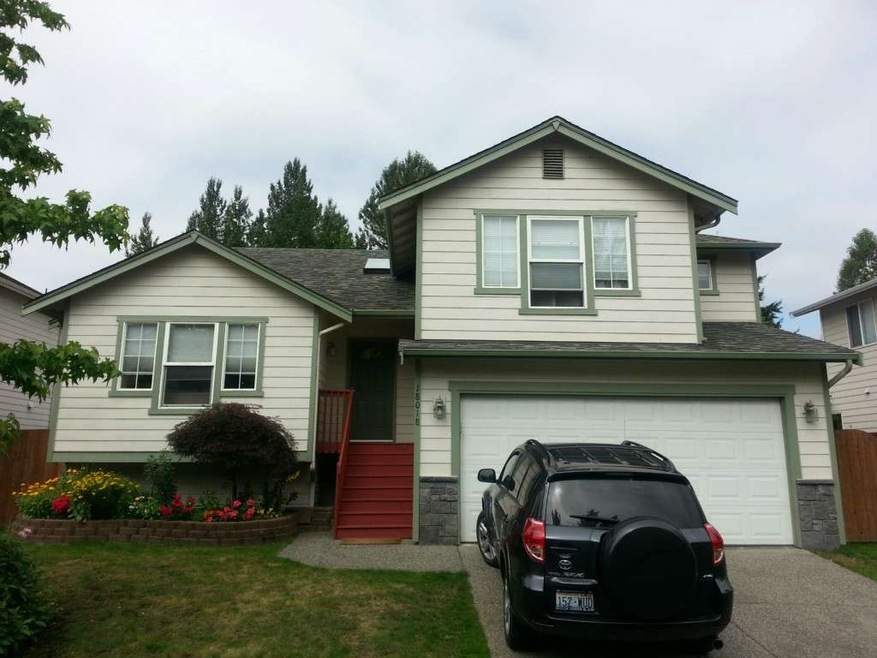
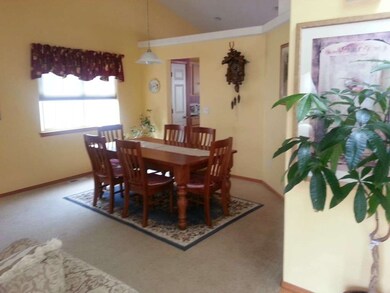
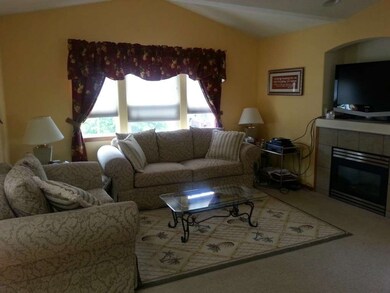
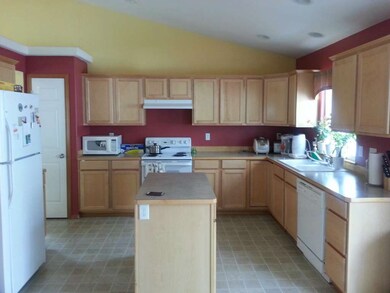
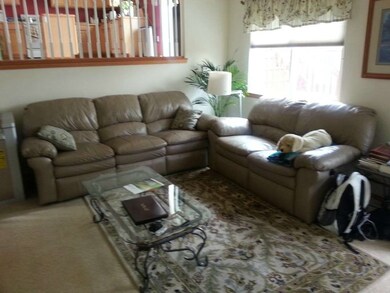
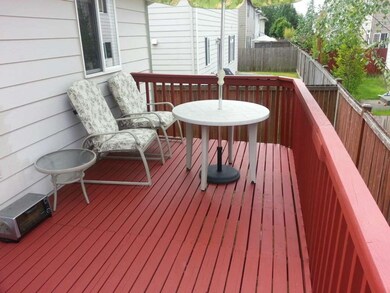
Spacious 3bed, 2.5bath,tri-Level in Waterbury Meadows. 1960 sqft w/ vaulted ceilings, large kitchen w/ nook, Island, Oak Cabinets,separate formal living/dining room,new hot water tank, gas fireplace and rear deck leads to lower patio. Large family room. Community Basketball/rec area. North shore schools district. Must see!
Source: Northwest Multiple Listing Service (NWMLS)
MLS#: NWM517593
Home Type
Other
Year Built
2002
Lot Details
4,792 Sq Ft Lot
We collect this data history from publicly available records. To have your information removed, we recommend requesting removal directly through your county’s website.
We collect this data history from publicly available records. To have your information removed, we recommend requesting removal directly through your county’s website.
| Date | Buyer | Sale Price | Title Company |
|---|---|---|---|
| $300,280 | Ticor Title | ||
| $245,280 | Ticor Title | ||
| -- | Multiple | ||
| $370,000 | Multiple | ||
| $280,000 | First American | ||
| $252,450 | -- |
We collect this data history from publicly available records. To have your information removed, we recommend requesting removal directly through your county’s website.
| Date | Status | Borrower | Loan Amount |
|---|---|---|---|
| Previous Owner | $183,750 | ||
| Previous Owner | $296,000 | ||
| Previous Owner | $37,000 | ||
| Previous Owner | $224,000 | ||
| Previous Owner | $252,450 | ||
| Closed | $42,000 |
We collect this data history from publicly available records. To have your information removed, we recommend requesting removal directly through your county’s website.
| Date | Event | Price | List to Sale | Price per Sq Ft | Prior Sale |
|---|---|---|---|---|---|
| 12/04/2013 12/04/13 | Sold | $300,000 | -6.2% | $153 / Sq Ft | |
| 11/22/2013 11/22/13 | Pending | -- | -- | -- | |
| 10/15/2013 10/15/13 | Price Changed | $319,950 | -1.5% | $163 / Sq Ft | |
| 09/17/2013 09/17/13 | Price Changed | $324,950 | -1.5% | $166 / Sq Ft | |
| 08/31/2013 08/31/13 | Price Changed | $329,950 | -1.5% | $168 / Sq Ft | |
| 08/21/2013 08/21/13 | Price Changed | $334,950 | 0.0% | $171 / Sq Ft | |
| 08/21/2013 08/21/13 | For Sale | $334,950 | -3.2% | $171 / Sq Ft | |
| 08/10/2013 08/10/13 | Pending | -- | -- | -- | |
| 07/16/2013 07/16/13 | For Sale | $345,900 | +41.2% | $176 / Sq Ft | |
| 02/15/2013 02/15/13 | Sold | $245,000 | 0.0% | $125 / Sq Ft | View Prior Sale |
| 08/07/2012 08/07/12 | Pending | -- | -- | -- | |
| 08/06/2012 08/06/12 | For Sale | $245,000 | -- | $125 / Sq Ft |
We collect this data history from publicly available records. To have your information removed, we recommend requesting removal directly through your county’s website.
| Year | Tax Paid | Tax Assessment Tax Assessment Total Assessment is a certain percentage of the fair market value that is determined by local assessors to be the total taxable value of land and additions on the property. | Land | Improvement |
|---|---|---|---|---|
| 2026 | $7,441 | $871,800 | $573,300 | $298,500 |
| 2025 | $7,441 | $828,200 | $537,700 | $290,500 |
| 2024 | $7,110 | $791,800 | $511,000 | $280,800 |
| 2023 | $7,597 | $944,300 | $625,000 | $319,300 |
| 2022 | $6,308 | $622,300 | $353,000 | $269,300 |
| 2020 | $6,052 | $563,700 | $340,000 | $223,700 |
| 2019 | $5,612 | $528,800 | $300,000 | $228,800 |
| 2018 | $5,327 | $467,400 | $260,000 | $207,400 |
| 2017 | $4,305 | $383,400 | $190,000 | $193,400 |
| 2016 | $4,149 | $360,600 | $175,000 | $185,600 |
| 2015 | $4,039 | $333,400 | $154,000 | $179,400 |
| 2013 | $1,852 | $272,000 | $120,000 | $152,000 |
Seller's Agent in 2013
Ki Kim
The Preview Group
(206) 334-2008
10 Total Sales
Source: Northwest Multiple Listing Service (NWMLS)
MLS Number: NWM517593
APN: 009339-000-011-00
Disclaimer: Certain information contained herein is derived from information provided by parties other than Homes.com. All information provided is deemed reliable, but is not guaranteed to be accurate and should be independently verified.
![]() All data is obtained from various sources and may not have been verified by broker or MLS GRID. Supplied Open House Information is subject to change without notice. All information should be independently reviewed and verified for accuracy. Properties may or may not be listed by the office/agent presenting the information. Listing information is provided by the Northwest Multiple Listing Service (NWMLS). Property information is based on available data that may include MLS information, county records, and other sources. Listings marked with the 3 tree icon and provided by NWMLS. All properties are subject to prior sale or withdrawal. IDX information is provided exclusively for consumers’ personal noncommercial use, that it may not be used for any purpose other than to identify prospective properties consumers may be interested in purchasing, that the data is deemed reliable but is not guaranteed by MLS GRID. ©2026 NWMLS.
All data is obtained from various sources and may not have been verified by broker or MLS GRID. Supplied Open House Information is subject to change without notice. All information should be independently reviewed and verified for accuracy. Properties may or may not be listed by the office/agent presenting the information. Listing information is provided by the Northwest Multiple Listing Service (NWMLS). Property information is based on available data that may include MLS information, county records, and other sources. Listings marked with the 3 tree icon and provided by NWMLS. All properties are subject to prior sale or withdrawal. IDX information is provided exclusively for consumers’ personal noncommercial use, that it may not be used for any purpose other than to identify prospective properties consumers may be interested in purchasing, that the data is deemed reliable but is not guaranteed by MLS GRID. ©2026 NWMLS.
Based on information submitted to the MLS GRID
Listings courtesy of Northwest Multiple Listing Service (NWMLS) as distributed by MLS GRID
Ask me questions while you tour the home.