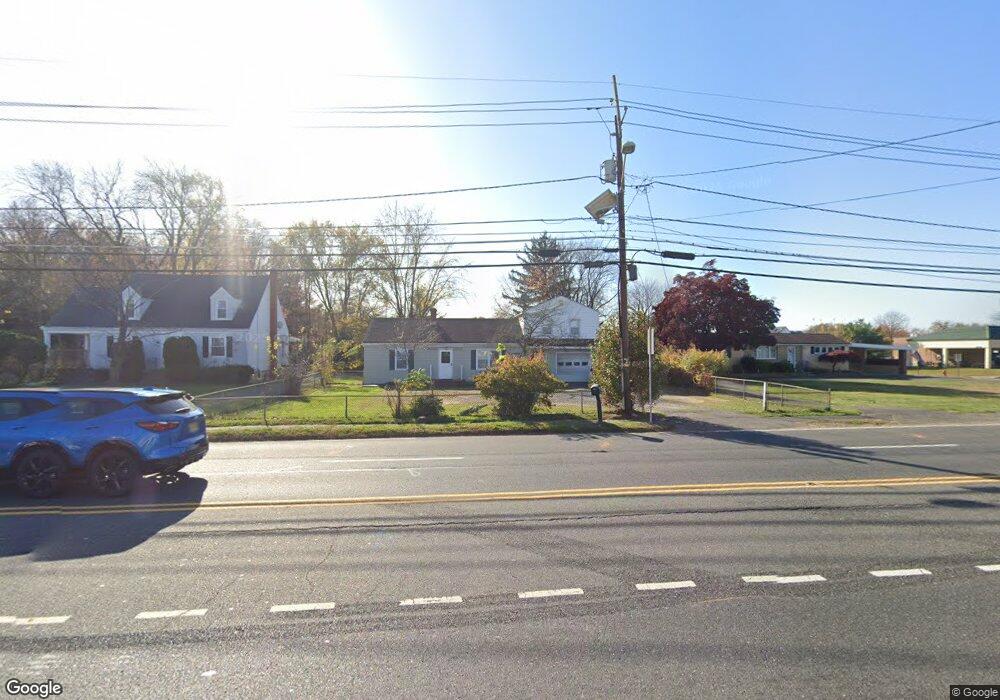
1802 Mount Holly Rd Burlington, NJ 08016
Estimated Value: $271,000
--
Bed
--
Bath
2,000
Sq Ft
$136/Sq Ft
Est. Value
About This Home
This home is located at 1802 Mount Holly Rd, Burlington, NJ 08016 and is currently priced at $271,000, approximately $135 per square foot. 1802 Mount Holly Rd is a home located in Burlington County with nearby schools including B Bernice Young Elementary School, Fountain Woods Elementary School, and Burlington Township Middle School at Springside.
Ownership History
Date
Name
Owned For
Owner Type
Purchase Details
Closed on
Dec 13, 2022
Sold by
Burlington Mount Holly Llc
Bought by
Burlington Mount Holly Llc
Current Estimated Value
Home Financials for this Owner
Home Financials are based on the most recent Mortgage that was taken out on this home.
Original Mortgage
$1,060,000
Outstanding Balance
$1,028,943
Interest Rate
7.08%
Mortgage Type
New Conventional
Purchase Details
Closed on
Nov 29, 2022
Sold by
Abele Joan E
Bought by
Burlington Mount Holly Llc
Home Financials for this Owner
Home Financials are based on the most recent Mortgage that was taken out on this home.
Original Mortgage
$1,060,000
Outstanding Balance
$1,028,943
Interest Rate
7.08%
Mortgage Type
New Conventional
Purchase Details
Closed on
Jun 24, 2008
Sold by
Gray Mildred I
Bought by
Abele William A
Create a Home Valuation Report for This Property
The Home Valuation Report is an in-depth analysis detailing your home's value as well as a comparison with similar homes in the area
Home Values in the Area
Average Home Value in this Area
Purchase History
| Date | Buyer | Sale Price | Title Company |
|---|---|---|---|
| Burlington Mount Holly Llc | -- | -- | |
| Burlington Mount Holly Llc | $540,000 | First American Title | |
| Abele William A | $232,000 | Foundation Title |
Source: Public Records
Mortgage History
| Date | Status | Borrower | Loan Amount |
|---|---|---|---|
| Open | Burlington Mount Holly Llc | $1,060,000 |
Source: Public Records
Tax History Compared to Growth
Tax History
| Year | Tax Paid | Tax Assessment Tax Assessment Total Assessment is a certain percentage of the fair market value that is determined by local assessors to be the total taxable value of land and additions on the property. | Land | Improvement |
|---|---|---|---|---|
| 2022 | $5,199 | $174,800 | $47,400 | $127,400 |
| 2021 | $5,251 | $174,800 | $47,400 | $127,400 |
| 2020 | $5,239 | $174,800 | $47,400 | $127,400 |
| 2019 | $5,251 | $174,800 | $47,400 | $127,400 |
| 2018 | $5,172 | $174,800 | $47,400 | $127,400 |
| 2017 | $5,141 | $174,800 | $47,400 | $127,400 |
| 2016 | $4,800 | $160,000 | $59,600 | $100,400 |
| 2015 | $4,717 | $160,000 | $59,600 | $100,400 |
| 2014 | $4,544 | $160,000 | $59,600 | $100,400 |
Source: Public Records
Map
Nearby Homes
- 802 Garnet Dr Unit 8B
- 1600 Mount Holly Rd
- 1605 Burlington Mt Holly Rd
- 15 18th St
- 102 Fountain Ave
- 0 & 20th Boudinot
- 402 Sunset Rd
- 73 Mill Rd
- 11 Wellington Place
- 152 E 7th St
- 93 Wellington Place
- 2031 Sylvan Park Rd
- 1110 Pope St
- 29 E 4th St
- 5 Primrose Dr
- 241 Mill Rd
- 828 Wood St
- 58 Heals Farm Rd Unit 1
- 54 Heals Farm Rd
- 30 Evergreen Ln
- 1804 Mount Holly Rd
- 1804 Mount Holly Rd
- 1800 Mount Holly Rd
- 1800 Mount Holly Rd
- 1800 Mount Holly Rd
- 1800 - 1802 - 1804 Route 541- Burlington Mt Holly Rd
- 1806 Mount Holly Rd
- 26 Carey Cir
- 1801 Mount Holly Rd
- 28 Carey Cir
- 1808 Mount Holly Road 10
- 1808 Mount Holly Rd
- 1808 10 Mount Holly Rd
- 24 Carey Cir
- 1805 Mount Holly Rd
- 2 Finnegans Way
- 1807 Mount Holly Rd
- 1702 Burlington-Mt Holly Rd Unit 7
- 1702 Burlington-Mt Holly Rd
- 21 Carey Cir