Estimated Value: $152,000 - $169,000
3
Beds
2
Baths
1,430
Sq Ft
$111/Sq Ft
Est. Value
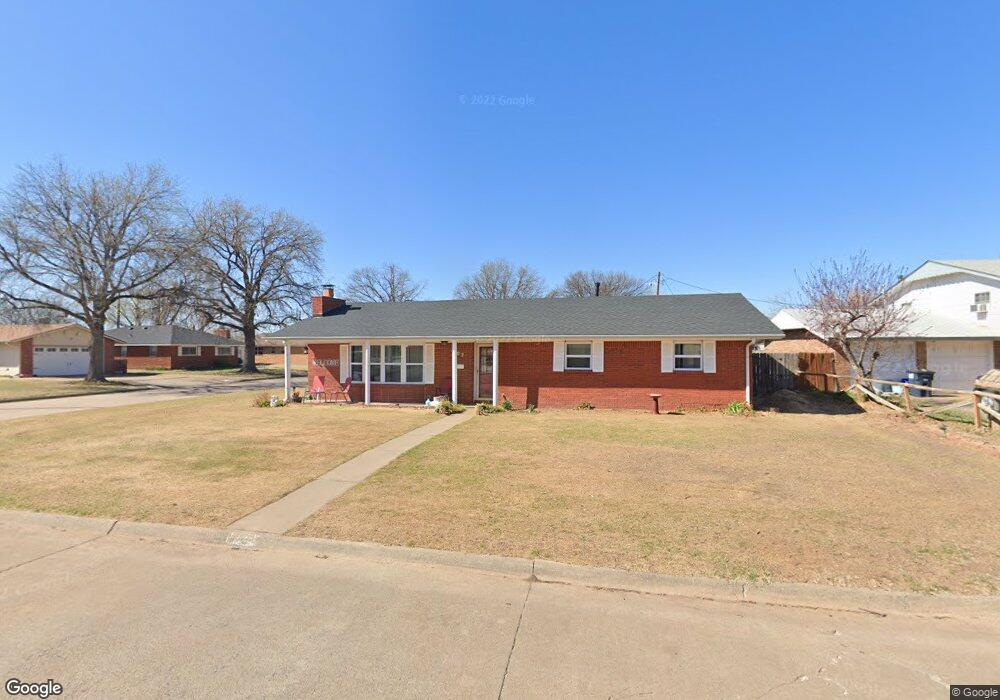
About This Home
This home is located at 1802 Navajo St, Enid, OK 73703 and is currently estimated at $158,780, approximately $111 per square foot. 1802 Navajo St is a home located in Garfield County with nearby schools including Hayes Elementary School, Dewitt Waller Middle School, and Enid High School.
Ownership History
Date
Name
Owned For
Owner Type
Purchase Details
Closed on
Jul 24, 2019
Sold by
Rose Natalie L and Rose Terry
Bought by
Rose Natalie L and Rose Terry
Current Estimated Value
Purchase Details
Closed on
Mar 11, 2014
Sold by
Marshall Jonathan M and Marshall Natalie L
Bought by
Marshall Natalie L and Marshall Jonathan M
Purchase Details
Closed on
Sep 4, 2009
Sold by
Marshall Jonathan M and Marshall Natalie L
Bought by
Marshall Jonathan M and Marshall Natalie
Purchase Details
Closed on
Jun 2, 2009
Sold by
Brashears Gregory N and Breshears Lee Ann
Bought by
Marshall Jonathan M
Home Financials for this Owner
Home Financials are based on the most recent Mortgage that was taken out on this home.
Original Mortgage
$79,872
Outstanding Balance
$50,627
Interest Rate
4.83%
Mortgage Type
VA
Estimated Equity
$108,153
Purchase Details
Closed on
Jun 28, 2002
Sold by
Schmidt Mary Ann
Bought by
Breshears Gregory N
Create a Home Valuation Report for This Property
The Home Valuation Report is an in-depth analysis detailing your home's value as well as a comparison with similar homes in the area
Home Values in the Area
Average Home Value in this Area
Purchase History
| Date | Buyer | Sale Price | Title Company |
|---|---|---|---|
| Rose Natalie L | -- | None Available | |
| Marshall Natalie L | -- | None Available | |
| Marshall Jonathan M | -- | None Available | |
| Marshall Jonathan M | $78,000 | None Available | |
| Breshears Gregory N | $56,000 | -- |
Source: Public Records
Mortgage History
| Date | Status | Borrower | Loan Amount |
|---|---|---|---|
| Open | Marshall Jonathan M | $79,872 |
Source: Public Records
Tax History Compared to Growth
Tax History
| Year | Tax Paid | Tax Assessment Tax Assessment Total Assessment is a certain percentage of the fair market value that is determined by local assessors to be the total taxable value of land and additions on the property. | Land | Improvement |
|---|---|---|---|---|
| 2024 | $1,464 | $14,874 | $1,370 | $13,504 |
| 2023 | $1,418 | $14,441 | $1,332 | $13,109 |
| 2022 | $1,393 | $14,020 | $1,295 | $12,725 |
| 2021 | $1,296 | $13,184 | $1,202 | $11,982 |
| 2020 | $1,284 | $12,799 | $1,163 | $11,636 |
| 2019 | $1,189 | $12,426 | $1,115 | $11,311 |
| 2018 | $1,149 | $12,066 | $1,180 | $10,886 |
| 2017 | $1,107 | $11,713 | $1,204 | $10,509 |
| 2016 | $1,027 | $11,372 | $0 | $0 |
| 2015 | $982 | $11,041 | $1,312 | $9,729 |
| 2014 | $950 | $10,720 | $1,312 | $9,408 |
Source: Public Records
Map
Nearby Homes
- 1705 S Johnson St
- 1910 W Rupe Ave
- 1733 W Thompson Ave
- 1513 Kaw St
- 1401 Beverly Dr
- 1351 S Johnson St
- 2002 Seneca Ave
- 1906 Seneca Ave
- 1417 W Thompson Ave
- 1418 Suggett Ave
- 2016 Ramona Dr
- 1409 Ponca Ave
- 2441 Robin Ridge
- 1305 Ritchie Ave
- 2106 Indian Dr
- 915 S Lincoln St
- 1512 Indian Dr
- 912 Brookside Dr
- 2105 Camelot Dr
- 1301 Indian Dr
- 1806 Navajo Place
- 1806 Navajo St
- 1726 Paris Place
- 1722 Paris Place
- 1710 S Hayes St
- 1706 S Hayes St
- 1714 S Hayes St
- 1826 Navajo St
- 1810 Navajo St
- 1702 S Hayes St
- 1822 Navajo St
- 1718 S Hayes St
- 1718 Paris Place
- 1814 Navajo St
- 1204 Kaw Cir
- 1203 Kaw Cir
- 1818 Navajo Place
- 1618 S Hayes St
- 1818 Navajo St
- 1714 Paris Place