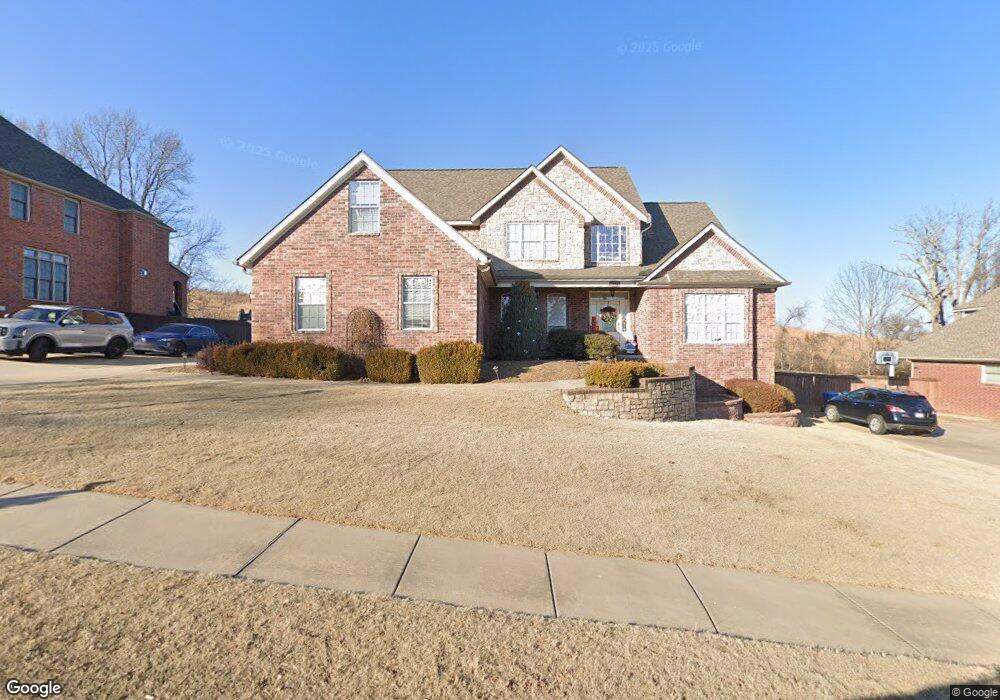
1802 NW Autumn Ridge Ave Bentonville, AR 72712
Estimated Value: $697,000 - $838,541
4
Beds
4
Baths
3,133
Sq Ft
$240/Sq Ft
Est. Value
About This Home
This home is located at 1802 NW Autumn Ridge Ave, Bentonville, AR 72712 and is currently estimated at $752,135, approximately $240 per square foot. 1802 NW Autumn Ridge Ave is a home located in Benton County with nearby schools including Thomas Jefferson Elementary School, Lincoln Junior High School, and Old High Middle School.
Ownership History
Date
Name
Owned For
Owner Type
Purchase Details
Closed on
Jun 5, 2023
Sold by
Kamalanathan Thambipillai and Kamalanathan Diane
Bought by
Jolly Marlin and Jolly Ashley
Current Estimated Value
Home Financials for this Owner
Home Financials are based on the most recent Mortgage that was taken out on this home.
Original Mortgage
$612,900
Outstanding Balance
$595,858
Interest Rate
6.39%
Mortgage Type
VA
Estimated Equity
$156,277
Purchase Details
Closed on
Aug 5, 2016
Sold by
Autumn Ave Property Llc
Bought by
Kamalanathan Thambipillai
Purchase Details
Closed on
Jun 30, 2004
Bought by
Kamalanathan
Purchase Details
Closed on
Jun 24, 2004
Bought by
Kamalanathan
Purchase Details
Closed on
Mar 13, 2003
Bought by
Knight Const
Create a Home Valuation Report for This Property
The Home Valuation Report is an in-depth analysis detailing your home's value as well as a comparison with similar homes in the area
Home Values in the Area
Average Home Value in this Area
Purchase History
| Date | Buyer | Sale Price | Title Company |
|---|---|---|---|
| Jolly Marlin | $600,000 | None Listed On Document | |
| Kamalanathan Thambipillai | $18,000 | First National Title Company | |
| Kamalanathan | $345,000 | -- | |
| Kamalanathan | $345,000 | -- | |
| Knight Const | $41,700 | -- |
Source: Public Records
Mortgage History
| Date | Status | Borrower | Loan Amount |
|---|---|---|---|
| Open | Jolly Marlin | $612,900 |
Source: Public Records
Tax History Compared to Growth
Tax History
| Year | Tax Paid | Tax Assessment Tax Assessment Total Assessment is a certain percentage of the fair market value that is determined by local assessors to be the total taxable value of land and additions on the property. | Land | Improvement |
|---|---|---|---|---|
| 2025 | $8,352 | $135,767 | $17,000 | $118,767 |
| 2024 | $8,390 | $135,767 | $17,000 | $118,767 |
| 2023 | $4,714 | $86,820 | $8,400 | $78,420 |
| 2022 | $4,243 | $86,820 | $8,400 | $78,420 |
| 2021 | $4,019 | $86,820 | $8,400 | $78,420 |
| 2020 | $3,850 | $66,320 | $15,860 | $50,460 |
| 2019 | $3,850 | $66,320 | $15,860 | $50,460 |
| 2018 | $3,875 | $66,320 | $15,860 | $50,460 |
| 2017 | $3,676 | $66,320 | $15,860 | $50,460 |
| 2016 | $3,676 | $66,320 | $15,860 | $50,460 |
| 2015 | $3,755 | $60,760 | $11,400 | $49,360 |
| 2014 | $3,405 | $60,760 | $11,400 | $49,360 |
Source: Public Records
Map
Nearby Homes
- 3702 NW Mountainview Rd
- 3703 NW Mountainview Rd
- 30 Theodore Dr
- 28 Theodore Dr
- 0 Theodore Dr
- 22 Miller Dr
- Lot 26, Block 2 Henrietta Ln
- 3 Amelia Cir
- 0 Amelia Cir Unit 1298352
- 0 Lookout Dr
- 0 Anthony Ln Unit 1311811
- 18 Hamilton Dr
- 3419 NW Riverbend Rd
- 3802 NW Riverbend Rd
- 0 Claxton Dr Unit 1327759
- 0 Suits Us Dr Unit 1323206
- 9 Hanna Dr
- 2311 NW Harvard Walk
- 16 Skyline Dr
- Lot 3 NW Hidden Cove
- 1802 NW Autumn Ave
- 1800 NW Autumn Ave
- 1804 NW Autumn Ave
- 408 NW Autumn Ave
- 0 NW Autumn Ave
- 80 M/L Acres Autumn Ave
- 32 Acres M/L Autumn Ave
- 46 Acres M/L Autumn Ave
- 1706 NW Autumn Ave
- 1803 NW Autumn Ave
- 1806 NW Autumn Ave
- 1801 NW Autumn Ave
- 1805 NW Autumn Ave
- 1707 NW Autumn Ave
- 1704 NW Autumn Ave
- 1808 NW Autumn Ave
- Lot 57 NW Autumn Rd
- 1705 NW Autumn Ave
- -- NW Mystic Dr
- 1802 NW Mystic Ave