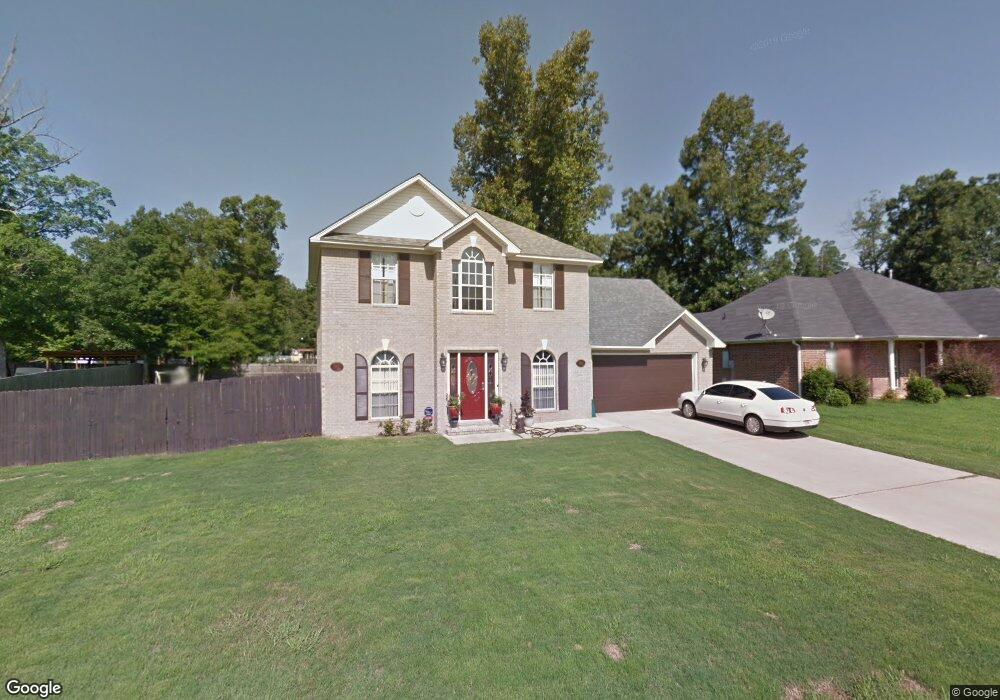
1802 Pleasant Pointe Cir Bryant, AR 72022
Estimated Value: $257,000 - $291,000
Studio
3
Baths
2,106
Sq Ft
$130/Sq Ft
Est. Value
About This Home
This home is located at 1802 Pleasant Pointe Cir, Bryant, AR 72022 and is currently estimated at $273,898, approximately $130 per square foot. 1802 Pleasant Pointe Cir is a home located in Saline County with nearby schools including Hill Farm Elementary School, Miner Academy, and Arkansas Christian Academy.
Ownership History
Date
Name
Owned For
Owner Type
Purchase Details
Closed on
Jun 30, 2025
Sold by
Shavers Dedrick M and Shavers Stacey O
Bought by
Shavers Stacey O
Current Estimated Value
Home Financials for this Owner
Home Financials are based on the most recent Mortgage that was taken out on this home.
Original Mortgage
$223,200
Outstanding Balance
$222,819
Interest Rate
6.81%
Mortgage Type
VA
Estimated Equity
$51,079
Purchase Details
Closed on
Apr 7, 2016
Sold by
Shavers Dedrick and Shavers Stacey
Bought by
Shavers Dedrick M and Shavers Stacey O
Home Financials for this Owner
Home Financials are based on the most recent Mortgage that was taken out on this home.
Original Mortgage
$191,000
Interest Rate
3.62%
Mortgage Type
VA
Purchase Details
Closed on
Apr 29, 2005
Sold by
Image Homes Inc
Bought by
Shavers Dedrick and Shavers Stacey
Home Financials for this Owner
Home Financials are based on the most recent Mortgage that was taken out on this home.
Original Mortgage
$176,368
Interest Rate
6.03%
Mortgage Type
VA
Purchase Details
Closed on
Sep 8, 2004
Bought by
Image Homes Inc
Purchase Details
Closed on
Aug 25, 2004
Bought by
Image Homes Inc
Create a Home Valuation Report for This Property
The Home Valuation Report is an in-depth analysis detailing your home's value as well as a comparison with similar homes in the area
Home Values in the Area
Average Home Value in this Area
Purchase History
| Date | Buyer | Sale Price | Title Company |
|---|---|---|---|
| Shavers Stacey O | -- | None Listed On Document | |
| Shavers Stacey O | -- | None Listed On Document | |
| Shavers Dedrick M | -- | Lenders Title Company | |
| Shavers Dedrick | $178,000 | -- | |
| Image Homes Inc | $20,000 | -- | |
| Image Homes Inc | $20,000 | -- |
Source: Public Records
Mortgage History
| Date | Status | Borrower | Loan Amount |
|---|---|---|---|
| Open | Shavers Stacey O | $223,200 | |
| Closed | Shavers Stacey O | $223,200 | |
| Previous Owner | Shavers Dedrick M | $191,000 | |
| Previous Owner | Shavers Dedrick | $176,368 |
Source: Public Records
Tax History
| Year | Tax Paid | Tax Assessment Tax Assessment Total Assessment is a certain percentage of the fair market value that is determined by local assessors to be the total taxable value of land and additions on the property. | Land | Improvement |
|---|---|---|---|---|
| 2025 | $2,266 | $44,796 | $7,000 | $37,796 |
| 2024 | $2,067 | $44,796 | $7,000 | $37,796 |
| 2023 | $1,887 | $44,796 | $7,000 | $37,796 |
| 2022 | $1,644 | $44,796 | $7,000 | $37,796 |
| 2021 | $1,555 | $36,830 | $5,000 | $31,830 |
| 2020 | $1,555 | $36,830 | $5,000 | $31,830 |
| 2019 | $1,555 | $36,830 | $5,000 | $31,830 |
| 2018 | $1,580 | $36,830 | $5,000 | $31,830 |
| 2017 | $1,562 | $36,830 | $5,000 | $31,830 |
| 2016 | $1,696 | $34,750 | $5,200 | $29,550 |
| 2015 | $1,696 | $34,750 | $5,200 | $29,550 |
| 2014 | $1,346 | $34,750 | $5,200 | $29,550 |
Source: Public Records
Map
Nearby Homes
- 1107 Fox Chase Dr
- 913 Amy Cir
- 117 W Lea Cir
- 304 SE 2nd St
- 208 Summerfield Dr
- 404 SE 1st St
- 330 N Elm St
- 404 NE 3rd St
- 5 Arcadia Cir
- 1602 Rodeo Dr
- 89 Bame Cir
- 37 Arcadia Cir
- 86 Bame Cir Unit 1
- 129 Prospect Park Dr
- 80 Bame Cir
- 473 Wisteria Dr
- 3707 Mount Carmel Rd
- 1004 N Reynolds Rd
- 1810 Bishop Rd
- 1007 Woodside Cove
- 1714 Pleasant Pointe Cir
- 1808 Pleasant Pointe Cir
- 1809 Pleasant Pointe Cir
- 1803 Pleasant Pointe Cir
- 1815 Pleasant Pointe Cir
- 1719 Pleasant Pointe Cir
- 1820 Pleasant Pointe Cir
- 1708 Pleasant Pointe Cir
- 1609 Pleasant Pointe Cir
- 1702 Pleasant Pointe Cir
- 1819 Pleasant Pointe Cir
- 1902 Pleasant Pointe Cir
- 1620 Pleasant Pointe Cir
- 1419 Pleasant Pointe Cir
- 1908 Pleasant Pointe Cir
- 1503 Pleasant Pointe Cir
- 1415 Pleasant Pointe Cir
- 1903 Pleasant Pointe Cir
- 1409 Pleasant Pointe Cir
- 1509 Pleasant Pointe Cir
Your Personal Tour Guide
Ask me questions while you tour the home.