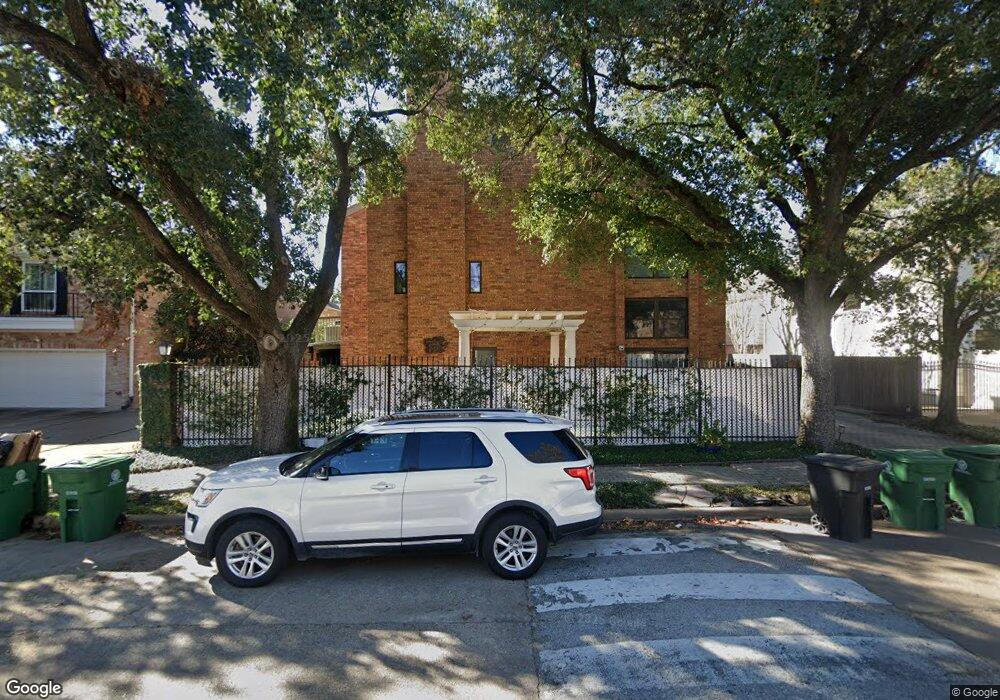
1802 Potomac Dr Unit A Houston, TX 77057
Uptown-Galleria District NeighborhoodEstimated Value: $662,452 - $729,000
3
Beds
3
Baths
3,054
Sq Ft
$226/Sq Ft
Est. Value
About This Home
This home is located at 1802 Potomac Dr Unit A, Houston, TX 77057 and is currently estimated at $690,863, approximately $226 per square foot. 1802 Potomac Dr Unit A is a home located in Harris County with nearby schools including Briargrove Elementary School, Tanglewood Middle, and Wisdom High School.
Ownership History
Date
Name
Owned For
Owner Type
Purchase Details
Closed on
Mar 17, 2021
Sold by
Montoya Linda and Montoya Luis Armando
Bought by
Rj Financing Group Llc
Current Estimated Value
Home Financials for this Owner
Home Financials are based on the most recent Mortgage that was taken out on this home.
Original Mortgage
$270,000
Outstanding Balance
$198,124
Interest Rate
2.2%
Mortgage Type
New Conventional
Estimated Equity
$492,739
Purchase Details
Closed on
Apr 23, 2018
Sold by
Mccloskey Mark E and Mccloskey Mayvic Luby
Bought by
Landry Leigh
Home Financials for this Owner
Home Financials are based on the most recent Mortgage that was taken out on this home.
Original Mortgage
$451,200
Interest Rate
4.46%
Mortgage Type
New Conventional
Purchase Details
Closed on
Aug 12, 2013
Sold by
Elliott Barbara N
Bought by
Mccloskey Mark E
Home Financials for this Owner
Home Financials are based on the most recent Mortgage that was taken out on this home.
Original Mortgage
$387,600
Interest Rate
4.49%
Create a Home Valuation Report for This Property
The Home Valuation Report is an in-depth analysis detailing your home's value as well as a comparison with similar homes in the area
Home Values in the Area
Average Home Value in this Area
Purchase History
| Date | Buyer | Sale Price | Title Company |
|---|---|---|---|
| Rj Financing Group Llc | -- | None Listed On Document | |
| Landry Leigh | -- | Chicago Title | |
| Mccloskey Mark E | -- | Stewart Title |
Source: Public Records
Mortgage History
| Date | Status | Borrower | Loan Amount |
|---|---|---|---|
| Open | Rj Financing Group Llc | $270,000 | |
| Previous Owner | Landry Leigh | $451,200 | |
| Previous Owner | Mccloskey Mark E | $387,600 |
Source: Public Records
Tax History Compared to Growth
Tax History
| Year | Tax Paid | Tax Assessment Tax Assessment Total Assessment is a certain percentage of the fair market value that is determined by local assessors to be the total taxable value of land and additions on the property. | Land | Improvement |
|---|---|---|---|---|
| 2025 | $9,328 | $710,576 | $157,717 | $552,859 |
| 2024 | $9,328 | $608,086 | $157,717 | $450,369 |
| 2023 | $9,328 | $647,788 | $157,717 | $490,071 |
| 2022 | $11,707 | $612,903 | $157,717 | $455,186 |
| 2021 | $11,265 | $483,335 | $157,717 | $325,618 |
| 2020 | $11,846 | $489,170 | $157,717 | $331,453 |
| 2019 | $12,516 | $494,604 | $157,717 | $336,887 |
| 2018 | $9,194 | $466,782 | $157,717 | $309,065 |
| 2017 | $11,803 | $466,782 | $157,717 | $309,065 |
| 2016 | $11,803 | $466,782 | $157,717 | $309,065 |
| 2015 | $8,264 | $458,046 | $157,717 | $300,329 |
| 2014 | $8,264 | $408,436 | $157,717 | $250,719 |
Source: Public Records
Map
Nearby Homes
- 1815 Potomac Dr Unit C
- 6007 San Felipe St Unit A
- 6104 San Felipe St
- 1628 Potomac Dr
- 1919 Potomac Dr
- 1923 Potomac Dr
- 5917 San Felipe St
- 6008 Inwood Dr
- 2009 Nantucket Dr
- 1616 Fountain View Dr Unit 209
- 1616 Fountain View Dr Unit 509
- 1616 Fountain View Dr Unit 202
- 1616 Fountain View Dr Unit 407
- 2113 Potomac Dr Unit D
- 2118 Nantucket Dr Unit C
- 1515 Potomac Dr Unit B
- 2117 Nantucket Dr
- 6206 San Felipe St
- 1425 Nantucket Dr Unit D
- 12 Jaime Nuno
- 1802 Potomac Dr
- 1802 Potomac Dr
- 1802 Potomac Dr Unit D
- 1802 Potomac Dr
- 1802 Potomac Dr Unit B
- 1802 Potomac Dr Unit C
- 1806 Potomac Dr
- 1806 Potomac Dr
- 1806 Potomac Dr
- 1806 Potomac Dr
- 1806 Potomac Dr Unit C
- 1806 Potomac Dr Unit B
- 1806 Potomac Dr Unit D
- 1722 Potomac Dr
- 1724 Potomac Dr
- 1810 Potomac Dr Unit 6
- 1810 Potomac Dr Unit 5
- 1810 Potomac Dr Unit 8
- 1810 Potomac Dr
- 1810 Potomac Dr Unit 7