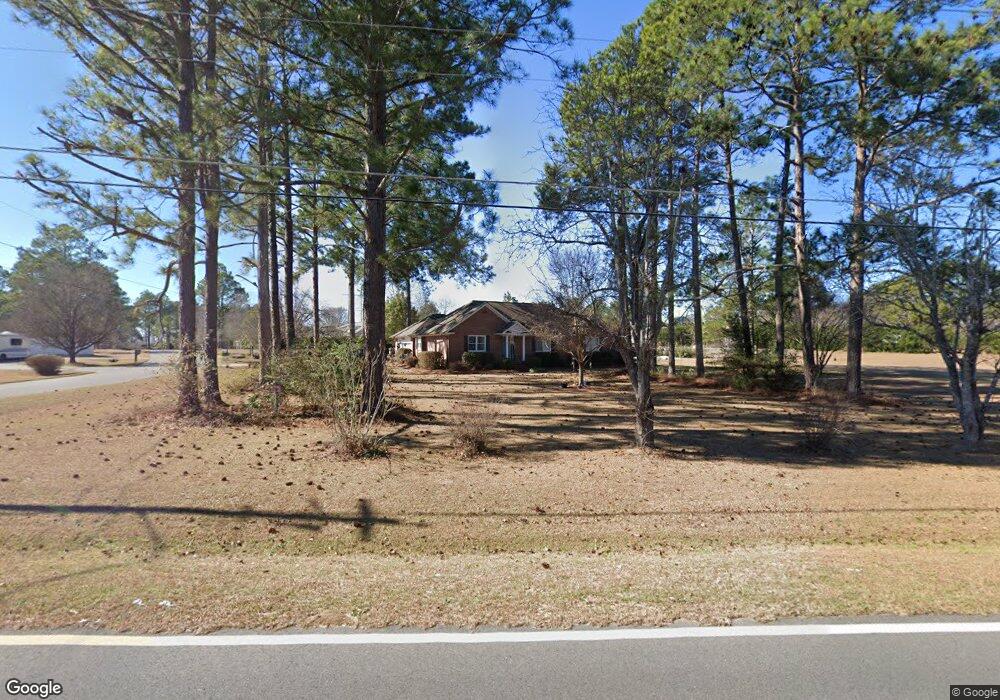
1802 Rutland Rd Tifton, GA 31793
Estimated Value: $282,000 - $324,986
3
Beds
2
Baths
1,874
Sq Ft
$161/Sq Ft
Est. Value
About This Home
This home is located at 1802 Rutland Rd, Tifton, GA 31793 and is currently estimated at $302,497, approximately $161 per square foot. 1802 Rutland Rd is a home located in Tift County with nearby schools including Annie Belle Clark Primary School, Matt Wilson Elementary School, and J.T. Reddick School.
Ownership History
Date
Name
Owned For
Owner Type
Purchase Details
Closed on
Jul 12, 2002
Sold by
Russell Winford D A and Russell K
Bought by
Russell Winford D and Russell Teresa L
Current Estimated Value
Purchase Details
Closed on
May 31, 2002
Sold by
Russell Bates L
Bought by
Russell Winford D A and Russell K
Purchase Details
Closed on
May 30, 2002
Sold by
Russellbebe Orel Harper Estate
Bought by
Russell Winford D
Purchase Details
Closed on
Nov 20, 1996
Sold by
Hampton Elmer L
Bought by
Russell Russell W and Russell Bebe
Purchase Details
Closed on
Oct 5, 1992
Bought by
Hampton Elmer L
Purchase Details
Closed on
Apr 25, 1991
Bought by
Meade Shelby J
Purchase Details
Closed on
Sep 5, 1990
Bought by
P B M Investment Company
Create a Home Valuation Report for This Property
The Home Valuation Report is an in-depth analysis detailing your home's value as well as a comparison with similar homes in the area
Home Values in the Area
Average Home Value in this Area
Purchase History
| Date | Buyer | Sale Price | Title Company |
|---|---|---|---|
| Russell Winford D | -- | -- | |
| Russell Winford D A | -- | -- | |
| Russell Winford D | -- | -- | |
| Russell Russell W | $123,000 | -- | |
| Hampton Elmer L | $103,500 | -- | |
| Meade Shelby J | $95,600 | -- | |
| P B M Investment Company | $6,500 | -- |
Source: Public Records
Tax History Compared to Growth
Tax History
| Year | Tax Paid | Tax Assessment Tax Assessment Total Assessment is a certain percentage of the fair market value that is determined by local assessors to be the total taxable value of land and additions on the property. | Land | Improvement |
|---|---|---|---|---|
| 2024 | $120 | $121,074 | $17,400 | $103,674 |
| 2023 | $96 | $86,462 | $9,792 | $76,670 |
| 2022 | $2,507 | $86,462 | $9,792 | $76,670 |
| 2021 | $2,522 | $86,462 | $9,792 | $76,670 |
| 2020 | $2,159 | $72,946 | $9,792 | $63,154 |
| 2019 | $2,154 | $72,946 | $9,792 | $63,154 |
| 2018 | $2,151 | $72,946 | $9,792 | $63,154 |
| 2017 | $2,161 | $72,946 | $9,792 | $63,154 |
| 2016 | $2,163 | $72,946 | $9,792 | $63,154 |
| 2015 | $2,164 | $72,946 | $9,792 | $63,154 |
| 2014 | $2,168 | $72,946 | $9,792 | $63,154 |
| 2013 | -- | $72,946 | $9,792 | $63,154 |
Source: Public Records
Map
Nearby Homes
- 1808 Rutland Rd
- 2008 Rutland Rd Unit 10
- 2008 Rutland Rd
- 100 Elizabeth Dr
- 26 Alan Ln
- Tract 1 Whiddon Mill Rd
- 31 Henry Way
- 131 Oak Point Ave
- 7 Deborah Dr
- 0 W Hutchinson Rd
- 106 Mill Ridge Cir
- 21 Willow Way
- W Hutchinson Rd
- 1901 Melba Dr
- 51 Logan Dr
- 1610 Mallard Ln
- 9 Country Club Place
- 1607 Mallard Ln
- 11 Fairway Dr
- 0 S Carpenter Rd
- 4005 Sandy Cir
- 1610 Rutland Rd
- 4007 Sandy Cir
- 1609 Rutland Rd
- 4006 Sandy Cir
- 1606 Rutland Rd
- 4202 Medford Ln
- 4009 Sandy Cir
- 0 Sandy Cir
- 4204 Medford Ln
- 1605 Rutland Rd
- 1605 Rutland Rd
- 4206 Medford Ln
- 4011 Sandy Cir
- 4003 Frazier Cir
- 4009 Frazier Cir
- 4004 Medford Ln
- 1602 Rutland Rd
- 4402 Medford Ln
- 1601 Rutland Rd