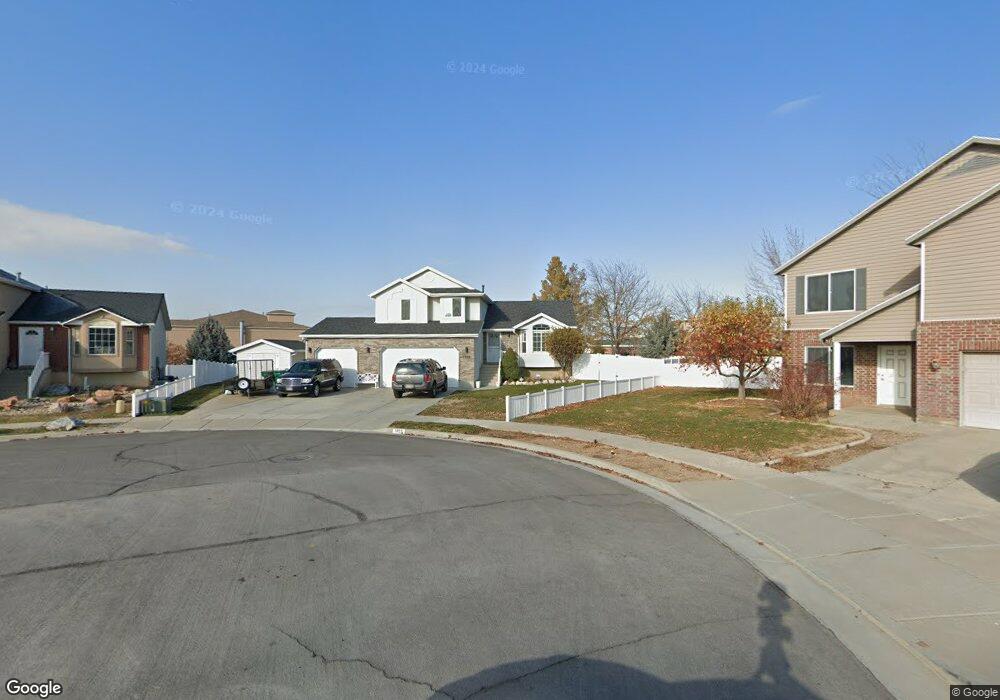
1802 S 500 E Clearfield, UT 84015
Estimated Value: $489,048 - $548,000
3
Beds
2
Baths
1,756
Sq Ft
$291/Sq Ft
Est. Value
About This Home
This home is located at 1802 S 500 E, Clearfield, UT 84015 and is currently estimated at $511,512, approximately $291 per square foot. 1802 S 500 E is a home located in Davis County with nearby schools including Antelope Elementary School, North Davis Junior High School, and Clearfield High School.
Ownership History
Date
Name
Owned For
Owner Type
Purchase Details
Closed on
May 13, 2002
Sold by
Mike Schultz Construction Inc
Bought by
Fullmer David W and Fullmer Carol A
Current Estimated Value
Home Financials for this Owner
Home Financials are based on the most recent Mortgage that was taken out on this home.
Original Mortgage
$157,600
Outstanding Balance
$64,815
Interest Rate
7.13%
Mortgage Type
VA
Estimated Equity
$446,697
Purchase Details
Closed on
Feb 27, 2002
Sold by
Ivins Kevin R
Bought by
Mike Schultz Construction Inc
Home Financials for this Owner
Home Financials are based on the most recent Mortgage that was taken out on this home.
Original Mortgage
$122,400
Interest Rate
6.8%
Mortgage Type
Credit Line Revolving
Create a Home Valuation Report for This Property
The Home Valuation Report is an in-depth analysis detailing your home's value as well as a comparison with similar homes in the area
Home Values in the Area
Average Home Value in this Area
Purchase History
| Date | Buyer | Sale Price | Title Company |
|---|---|---|---|
| Fullmer David W | -- | Heritage West Title Insuranc | |
| Mike Schultz Construction Inc | -- | Heritage West Title Insuranc |
Source: Public Records
Mortgage History
| Date | Status | Borrower | Loan Amount |
|---|---|---|---|
| Open | Fullmer David W | $157,600 | |
| Previous Owner | Mike Schultz Construction Inc | $122,400 |
Source: Public Records
Tax History
| Year | Tax Paid | Tax Assessment Tax Assessment Total Assessment is a certain percentage of the fair market value that is determined by local assessors to be the total taxable value of land and additions on the property. | Land | Improvement |
|---|---|---|---|---|
| 2025 | -- | $267,300 | $87,204 | $180,096 |
| 2024 | $666 | $262,350 | $83,253 | $179,097 |
| 2023 | $545 | $439,000 | $131,614 | $307,386 |
| 2022 | $1,623 | $259,050 | $73,841 | $185,209 |
| 2021 | $1,629 | $371,000 | $86,920 | $284,080 |
| 2020 | $1,278 | $320,000 | $74,756 | $245,244 |
| 2019 | $1,217 | $307,000 | $72,398 | $234,602 |
| 2018 | $1,082 | $282,000 | $64,261 | $217,739 |
| 2016 | $749 | $126,610 | $26,230 | $100,380 |
| 2015 | $1,822 | $117,480 | $26,230 | $91,250 |
| 2014 | $582 | $112,496 | $26,230 | $86,266 |
| 2013 | -- | $101,806 | $32,630 | $69,176 |
Source: Public Records
Map
Nearby Homes
- 460 E 1700 S Unit 1 & 2
- 308 E 1925 S
- 668 E 2000 S
- 1477 N 2375 W
- 1916 N Celia Way
- 195 E 2325 S
- 154 E 2325 S
- 1250 N 2925 W
- 1818 S 200 W
- 1740 N Gregory Dr
- 1430 N 2100 W
- 1896 Cliff Place
- 1021 E 1225 S Unit A
- 990 E 1150 S
- 2181 Katies Way
- 1596 N Main St Unit 2
- 1491 N 1875 W
- 1491 N 1875 W Unit 158
- 1847 John St
- 1487 N 1875 W
Your Personal Tour Guide
Ask me questions while you tour the home.