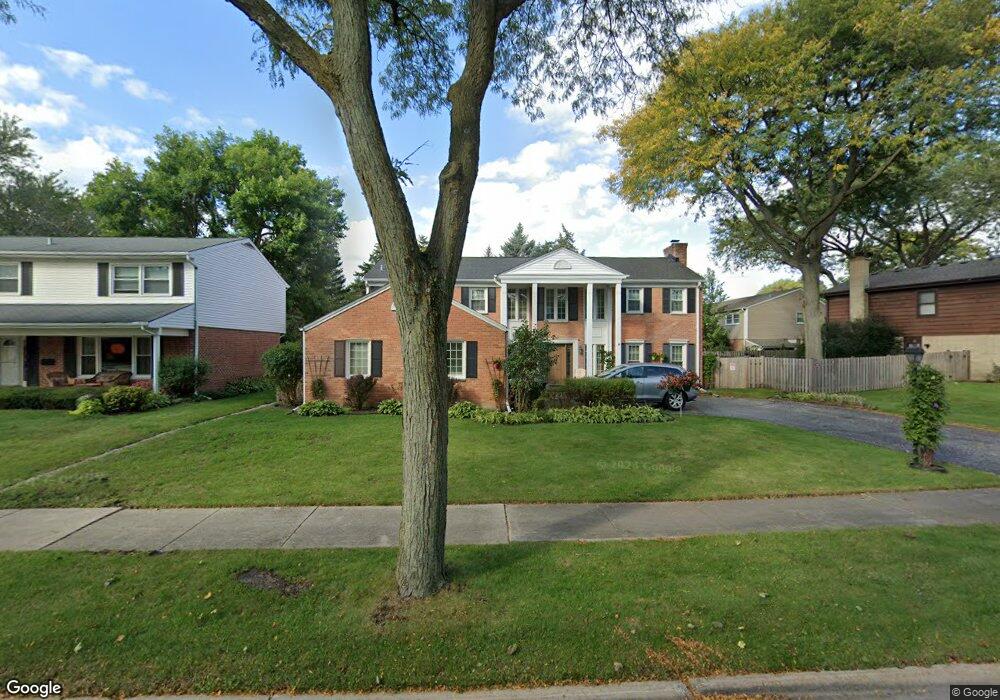
1802 S Fernandez Ave Arlington Heights, IL 60005
Estimated Value: $577,000 - $746,000
4
Beds
3
Baths
3,352
Sq Ft
$203/Sq Ft
Est. Value
About This Home
This home is located at 1802 S Fernandez Ave, Arlington Heights, IL 60005 and is currently estimated at $682,065, approximately $203 per square foot. 1802 S Fernandez Ave is a home located in Cook County with nearby schools including Holmes Jr High School, Juliette Low Elementary School, and Rolling Meadows High School.
Ownership History
Date
Name
Owned For
Owner Type
Purchase Details
Closed on
Sep 29, 2009
Sold by
Deutsche Bank Trust Company Americas
Bought by
Community Savings Bank and Trust #Lt-2342
Current Estimated Value
Purchase Details
Closed on
Apr 13, 2009
Sold by
Carson Patsy M and Carson Patsy
Bought by
Deutshce Bank National Trust Company Ame and Rali 2006Qa6
Purchase Details
Closed on
May 19, 2006
Sold by
Chicago Title Land Trust Co
Bought by
Carson R Lavance and Carson Patsy M
Home Financials for this Owner
Home Financials are based on the most recent Mortgage that was taken out on this home.
Original Mortgage
$90,000
Interest Rate
6.62%
Mortgage Type
Stand Alone Second
Purchase Details
Closed on
Jan 24, 2000
Sold by
Carson R Lavance and Carson Patsy M
Bought by
American National Bank Of Chicago and Trust #125620-0-5
Create a Home Valuation Report for This Property
The Home Valuation Report is an in-depth analysis detailing your home's value as well as a comparison with similar homes in the area
Home Values in the Area
Average Home Value in this Area
Purchase History
| Date | Buyer | Sale Price | Title Company |
|---|---|---|---|
| Community Savings Bank | $302,000 | Fatic | |
| Deutshce Bank National Trust Company Ame | -- | None Available | |
| Carson R Lavance | -- | Stewart Title Of Illinois | |
| American National Bank Of Chicago | -- | -- |
Source: Public Records
Mortgage History
| Date | Status | Borrower | Loan Amount |
|---|---|---|---|
| Previous Owner | Carson R Lavance | $90,000 |
Source: Public Records
Tax History Compared to Growth
Tax History
| Year | Tax Paid | Tax Assessment Tax Assessment Total Assessment is a certain percentage of the fair market value that is determined by local assessors to be the total taxable value of land and additions on the property. | Land | Improvement |
|---|---|---|---|---|
| 2024 | $11,219 | $50,000 | $7,946 | $42,054 |
| 2023 | $7,478 | $50,000 | $7,946 | $42,054 |
| 2022 | $7,478 | $50,000 | $7,946 | $42,054 |
| 2021 | $8,619 | $40,976 | $5,164 | $35,812 |
| 2020 | $9,546 | $40,976 | $5,164 | $35,812 |
| 2019 | $9,915 | $46,041 | $5,164 | $40,877 |
| 2018 | $8,510 | $39,801 | $4,370 | $35,431 |
| 2017 | $8,241 | $39,801 | $4,370 | $35,431 |
| 2016 | $10,266 | $39,801 | $4,370 | $35,431 |
| 2015 | $9,152 | $37,493 | $3,973 | $33,520 |
| 2014 | $11,167 | $40,786 | $3,973 | $36,813 |
| 2013 | $10,897 | $40,786 | $3,973 | $36,813 |
Source: Public Records
Map
Nearby Homes
- 1607 S Kaspar Ave
- 2234 S Crambourne Way
- 1515 S Harvard Ave
- 1107 W White Oak St
- 1355 S Dunton Ave
- 5600 Astor Ln Unit 103
- 1187 S Ridge Ave
- 1114 S Fernandez Ave
- 1306 S New Wilke Rd Unit 2B
- 1322 S New Wilke Rd Unit 1C
- 1860 W Surrey Park Ln Unit 1C
- 5451 Elizabeth Place Unit 906
- 1025 S Fernandez Ave Unit 3M
- 1535 S Douglas Ave
- 2206 S Goebbert Rd Unit 409
- 1227 S Old Wilke Rd Unit 201
- 1227 S Old Wilke Rd Unit 306
- 700 S Noah Terrace
- 1206 S New Wilke Rd Unit 108
- 1217 S Old Wilke Rd Unit 11110
- 1806 S Fernandez Ave
- 1714 S Fernandez Ave
- 1712 S Fernandez Ave
- 1810 S Fernandez Ave
- 1818 S Ridge Dr
- 1719 S Fernandez Ave
- 1710 S Fernandez Ave
- 1814 S Fernandez Ave
- 1715 S Fernandez Ave
- 1815 S Fernandez Ave
- 806 W Golf Rd
- 1711 S Fernandez Ave
- 1814 S Ridge Dr
- 1708 S Fernandez Ave
- 1718 S Ridge Dr
- 1707 S Fernandez Ave
- 1817 S Ridge Dr
- 1714 S Ridge Dr
- 1706 S Fernandez Ave
- 1710 S Ridge Dr