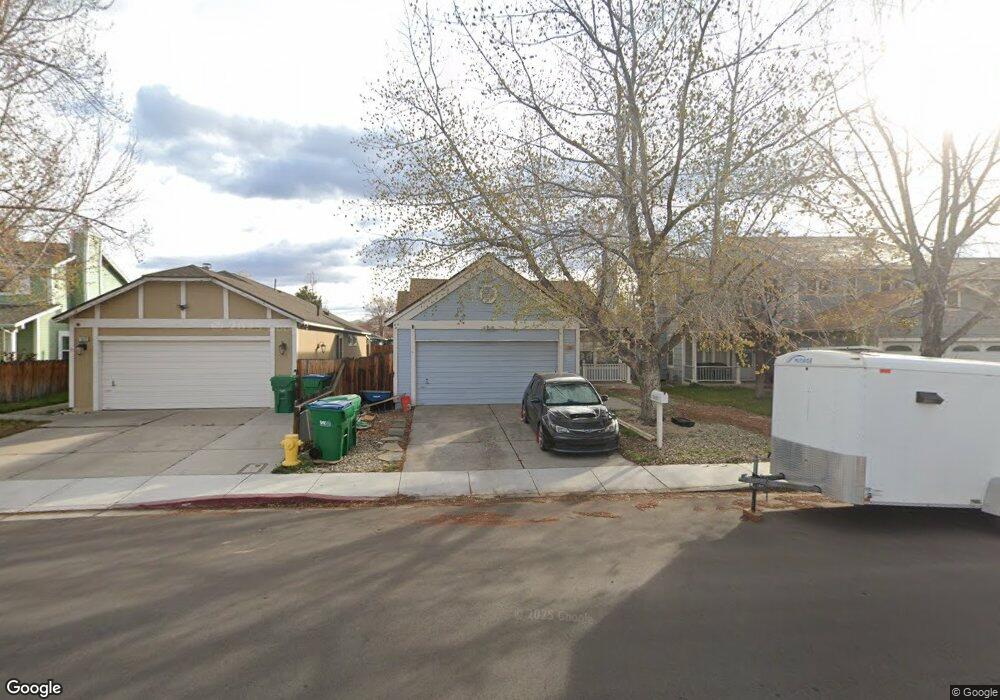
1802 Union St Sparks, NV 89434
O'Callaghan NeighborhoodEstimated Value: $426,000 - $453,000
3
Beds
2
Baths
1,376
Sq Ft
$316/Sq Ft
Est. Value
About This Home
This home is located at 1802 Union St, Sparks, NV 89434 and is currently estimated at $435,096, approximately $316 per square foot. 1802 Union St is a home located in Washoe County with nearby schools including Katherine Dunn Elementary School, George L Dilworth Middle School, and Edward C Reed High School.
Ownership History
Date
Name
Owned For
Owner Type
Purchase Details
Closed on
Nov 13, 2012
Sold by
Gingles Mark
Bought by
Gingles Mark and The Mark Gingles 2012 Trust
Current Estimated Value
Purchase Details
Closed on
Aug 13, 2001
Sold by
Brandt Carol J
Bought by
Gingles Mark
Home Financials for this Owner
Home Financials are based on the most recent Mortgage that was taken out on this home.
Original Mortgage
$63,000
Interest Rate
7.05%
Purchase Details
Closed on
Nov 17, 1998
Sold by
Dorfman Marlene R
Bought by
Brandt Carol J
Home Financials for this Owner
Home Financials are based on the most recent Mortgage that was taken out on this home.
Original Mortgage
$122,700
Interest Rate
6.84%
Mortgage Type
FHA
Purchase Details
Closed on
Nov 11, 1998
Sold by
Dorfman Donald C
Bought by
Dorfman Marlene R
Home Financials for this Owner
Home Financials are based on the most recent Mortgage that was taken out on this home.
Original Mortgage
$122,700
Interest Rate
6.84%
Mortgage Type
FHA
Create a Home Valuation Report for This Property
The Home Valuation Report is an in-depth analysis detailing your home's value as well as a comparison with similar homes in the area
Home Values in the Area
Average Home Value in this Area
Purchase History
| Date | Buyer | Sale Price | Title Company |
|---|---|---|---|
| Gingles Mark | -- | None Available | |
| Gingles Mark | $146,000 | Stewart Title Northern Nevad | |
| Brandt Carol J | $137,000 | First Centennial Title Co Of | |
| Dorfman Marlene R | -- | First Centennial Title Co Of |
Source: Public Records
Mortgage History
| Date | Status | Borrower | Loan Amount |
|---|---|---|---|
| Closed | Gingles Mark | $63,000 | |
| Previous Owner | Brandt Carol J | $122,700 |
Source: Public Records
Tax History
| Year | Tax Paid | Tax Assessment Tax Assessment Total Assessment is a certain percentage of the fair market value that is determined by local assessors to be the total taxable value of land and additions on the property. | Land | Improvement |
|---|---|---|---|---|
| 2026 | -- | $68,549 | $34,650 | $33,899 |
| 2024 | $1,843 | $68,466 | $32,725 | $35,741 |
| 2023 | $1,788 | $66,598 | $32,305 | $34,293 |
| 2022 | $1,738 | $54,910 | $26,005 | $28,905 |
| 2021 | $1,608 | $48,918 | $19,845 | $29,073 |
| 2020 | $1,512 | $49,269 | $19,775 | $29,494 |
| 2019 | $1,439 | $47,825 | $18,935 | $28,890 |
| 2018 | $1,373 | $42,436 | $13,965 | $28,471 |
| 2017 | $1,318 | $41,448 | $12,670 | $28,778 |
| 2016 | $1,285 | $41,078 | $11,410 | $29,668 |
| 2015 | $323 | $39,585 | $9,625 | $29,960 |
| 2014 | $1,219 | $36,346 | $8,225 | $28,121 |
| 2013 | -- | $32,637 | $6,090 | $26,547 |
Source: Public Records
Map
Nearby Homes
- 1674 Sabatino Dr
- 1655 Sabatino Dr
- 2227 Valencia Way
- 2140 Burnside Dr
- 2264 Fernwood Ct
- 1236 Flora Glen Dr
- 2407 Sunny Slope Dr Unit 1
- 1308 Coachman Dr
- 1544 Woodhaven Ln
- 2507 Sycamore Glen Dr Unit 5
- 2624 Sunny Slope Dr Unit 10
- 2625 Sunny Slope Dr
- 2625 Sunny Slope Dr Unit 2
- 2627 Sunny Slope Dr Unit 5
- 2659 Sycamore Glen Dr Unit 5
- 2679 Sycamore Glen Dr Unit 4
- 1218 Junction Dr
- 1357 Coupler Ct
- 2688 Laguna Way
- 1695 Atlantic Way
- 1822 Union St
- 1792 Union St
- 1832 Union St
- 1782 Union St
- 1871 Burnside Dr
- 1851 Burnside Dr
- 1901 Burnside Dr
- 1842 Union St
- 1841 Burnside Dr
- 1772 Union St
- 1911 Burnside Dr
- 1831 Burnside Dr
- 1793 Union St
- 1823 Union St
- 1862 Union St
- 1921 Burnside Dr
- 1762 Union St
- 1783 Union St
- 1833 Union St
- 1931 Burnside Dr
Your Personal Tour Guide
Ask me questions while you tour the home.