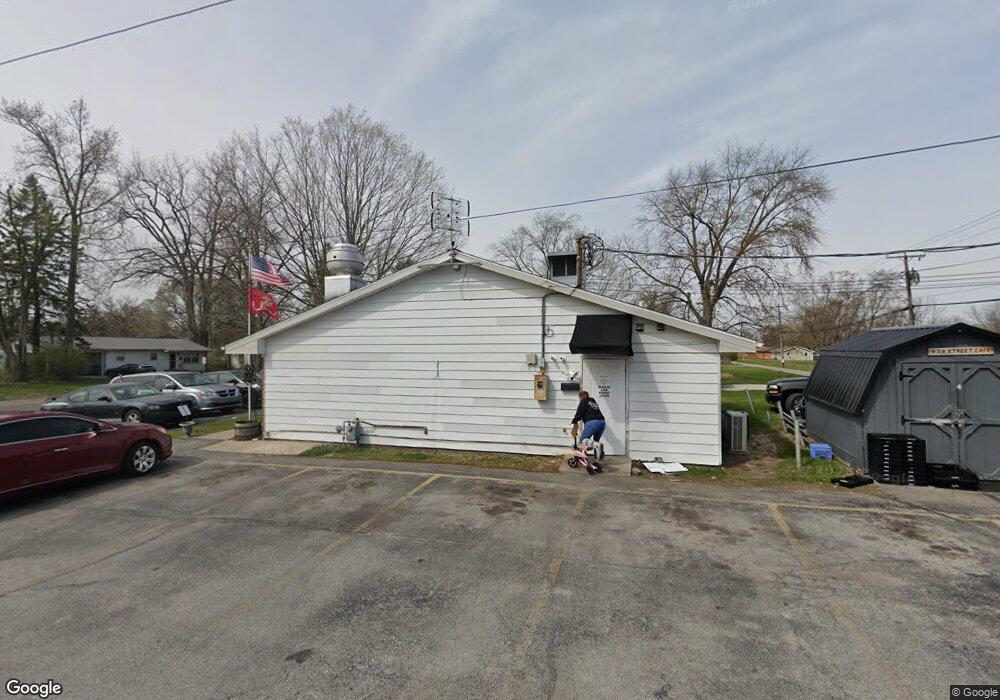
1802 W 9th St Marion, IN 46953
Westside NeighborhoodEstimated Value: $255,630
--
Bed
--
Bath
2,958
Sq Ft
$86/Sq Ft
Est. Value
About This Home
This home is located at 1802 W 9th St, Marion, IN 46953 and is currently estimated at $255,630, approximately $86 per square foot. 1802 W 9th St is a home located in Grant County with nearby schools including John W. Kendall Elementary School, John L. McCulloch Junior High School, and Justice Thurgood Marshall Intermediate School.
Ownership History
Date
Name
Owned For
Owner Type
Purchase Details
Closed on
Dec 15, 2022
Sold by
Harner Paula E
Bought by
Big Red Holdings Llc
Current Estimated Value
Home Financials for this Owner
Home Financials are based on the most recent Mortgage that was taken out on this home.
Original Mortgage
$185,000
Outstanding Balance
$172,048
Interest Rate
6.95%
Mortgage Type
New Conventional
Estimated Equity
$83,582
Purchase Details
Closed on
Dec 9, 2002
Sold by
Not Provided
Bought by
Not Provided
Create a Home Valuation Report for This Property
The Home Valuation Report is an in-depth analysis detailing your home's value as well as a comparison with similar homes in the area
Home Values in the Area
Average Home Value in this Area
Purchase History
| Date | Buyer | Sale Price | Title Company |
|---|---|---|---|
| Big Red Holdings Llc | -- | -- | |
| Not Provided | -- | -- |
Source: Public Records
Mortgage History
| Date | Status | Borrower | Loan Amount |
|---|---|---|---|
| Open | Big Red Holdings Llc | $185,000 |
Source: Public Records
Tax History Compared to Growth
Tax History
| Year | Tax Paid | Tax Assessment Tax Assessment Total Assessment is a certain percentage of the fair market value that is determined by local assessors to be the total taxable value of land and additions on the property. | Land | Improvement |
|---|---|---|---|---|
| 2024 | $1,716 | $57,200 | $13,800 | $43,400 |
| 2023 | $1,440 | $48,000 | $13,800 | $34,200 |
| 2022 | $1,440 | $48,000 | $13,800 | $34,200 |
| 2021 | $1,419 | $47,300 | $13,800 | $33,500 |
| 2020 | $1,419 | $47,300 | $13,800 | $33,500 |
| 2019 | $1,419 | $47,300 | $13,800 | $33,500 |
| 2018 | $1,419 | $47,300 | $13,800 | $33,500 |
| 2017 | $1,398 | $46,600 | $13,800 | $32,800 |
| 2016 | $1,398 | $46,600 | $13,800 | $32,800 |
| 2014 | $1,395 | $46,500 | $13,800 | $32,700 |
| 2013 | $1,395 | $46,300 | $13,800 | $32,500 |
Source: Public Records
Map
Nearby Homes
- 1017 S Park Ave
- 2115 W 8th St
- 1648 Mason Blvd
- 303 S Lenfesty Ave
- 2200 W 2nd St
- 1534 W 2nd St
- 712 S G St
- 1148 W 6th St
- 1146 W 6th St
- 1133 W 4th St
- 1108 W 6th St Unit Grant county
- 1108 W 6th St
- 1136 W 3rd St
- 1024 W 5th St
- 413 S Grove St
- 1309 W 1st St
- 1512 W Spencer Ave
- 1436 W Spencer Ave
- 1015 W 3rd St
- 812 W 10th St