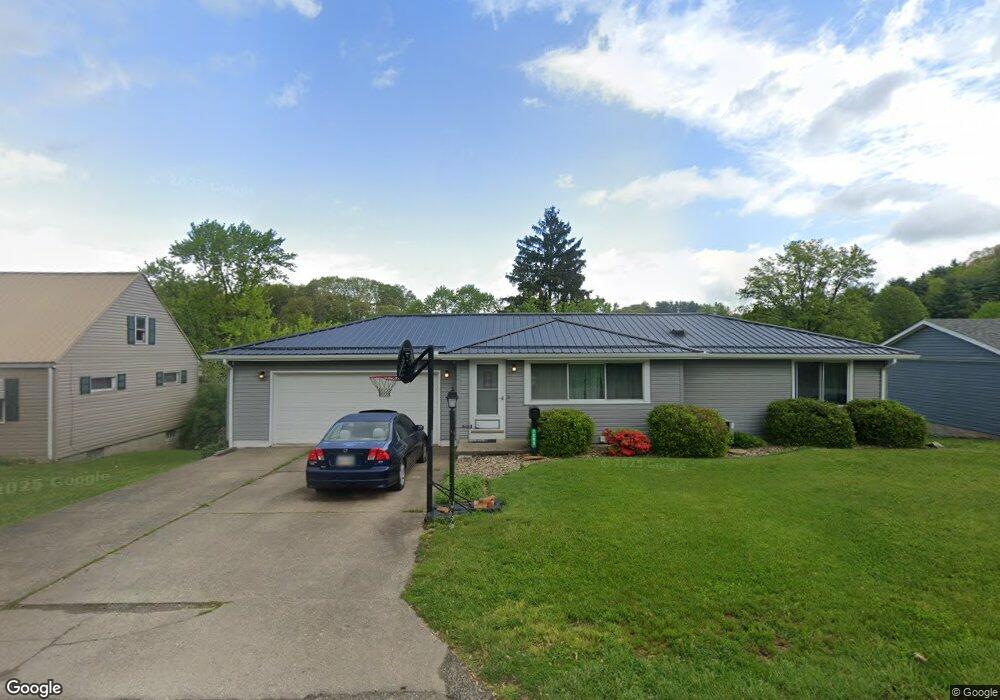
1802 Walnut St Coshocton, OH 43812
Estimated Value: $147,543 - $183,000
3
Beds
1
Bath
1,000
Sq Ft
$166/Sq Ft
Est. Value
About This Home
This home is located at 1802 Walnut St, Coshocton, OH 43812 and is currently estimated at $166,136, approximately $166 per square foot. 1802 Walnut St is a home located in Coshocton County with nearby schools including Coshocton High School, Coshocton Opportunity School, and Sacred Heart Elementary School.
Ownership History
Date
Name
Owned For
Owner Type
Purchase Details
Closed on
Feb 27, 2019
Sold by
Courtright William L and Gracyk Joseph S
Bought by
Courtright William L
Current Estimated Value
Purchase Details
Closed on
Mar 19, 2003
Bought by
Courtright William L
Purchase Details
Closed on
May 3, 2002
Sold by
Zars Douglas M
Bought by
Secretary Of Housing Urban
Purchase Details
Closed on
Oct 12, 1993
Sold by
Tumblin Walker L
Bought by
Zars Douglas M
Purchase Details
Closed on
Dec 1, 1988
Create a Home Valuation Report for This Property
The Home Valuation Report is an in-depth analysis detailing your home's value as well as a comparison with similar homes in the area
Home Values in the Area
Average Home Value in this Area
Purchase History
| Date | Buyer | Sale Price | Title Company |
|---|---|---|---|
| Courtright William L | $32,000 | Mortgage Connect Lp | |
| Courtright William L | -- | -- | |
| Secretary Of Housing Urban | -- | -- | |
| Zars Douglas M | $57,500 | -- | |
| -- | $51,000 | -- |
Source: Public Records
Tax History
| Year | Tax Paid | Tax Assessment Tax Assessment Total Assessment is a certain percentage of the fair market value that is determined by local assessors to be the total taxable value of land and additions on the property. | Land | Improvement |
|---|---|---|---|---|
| 2024 | $1,489 | $36,070 | $6,100 | $29,970 |
| 2023 | $1,489 | $26,856 | $4,473 | $22,383 |
| 2022 | $1,280 | $26,856 | $4,473 | $22,383 |
| 2021 | $1,282 | $26,856 | $4,473 | $22,383 |
| 2020 | $1,189 | $24,102 | $4,358 | $19,744 |
| 2019 | $1,203 | $24,102 | $4,358 | $19,744 |
| 2018 | $1,166 | $24,102 | $4,358 | $19,744 |
| 2017 | $1,177 | $22,929 | $3,885 | $19,044 |
| 2016 | $1,128 | $22,929 | $3,885 | $19,044 |
| 2015 | $134 | $22,929 | $3,885 | $19,044 |
| 2014 | $1,002 | $21,840 | $3,885 | $17,955 |
Source: Public Records
Map
Nearby Homes
- 602 Highland Blvd
- 608 Highland Blvd
- 828 Green Dr
- 1407 Elm St
- 1627 Hay Ave
- 1421 Chestnut St
- 0 N 15th St Unit 5180444
- 303 N 15th St
- 0 Cambridge Rd Unit 5183799
- Lot# 1, S 12th St
- 597 S 12th St
- 6 S 12th St
- 5 S 12th St
- 3 S 12th St
- Lot 7 Country Club Dr
- Lot 2 Country Club Dr
- Lot 1 Country Club Dr
- Lot 5 Country Club Dr
- Lot 4 Country Club Dr
- Lot 3 Country Club Dr
Your Personal Tour Guide
Ask me questions while you tour the home.