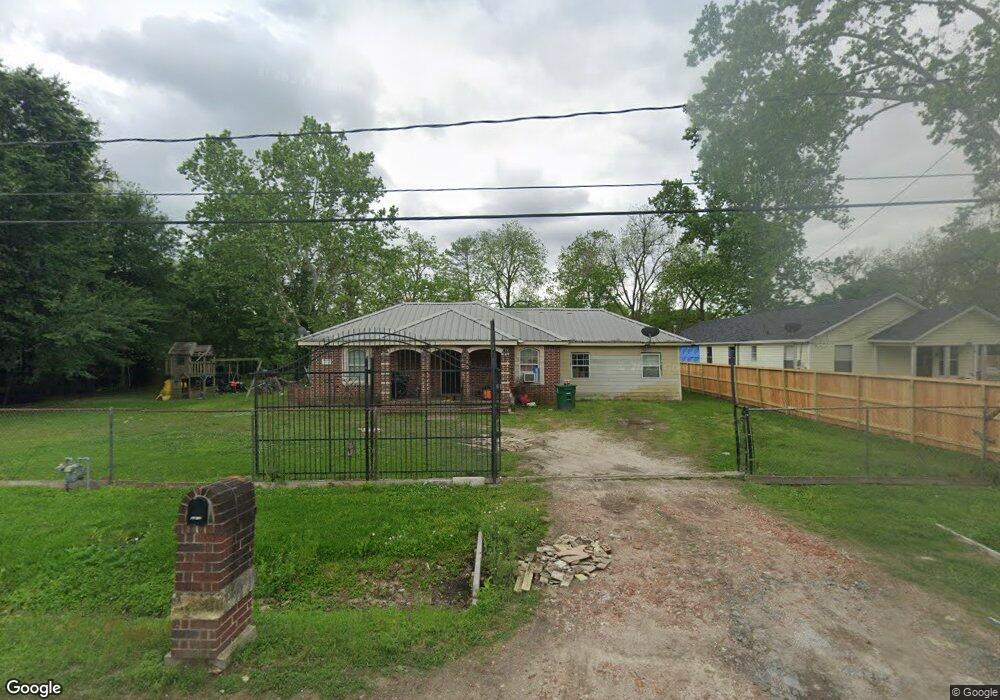
1802 Wellington St Houston, TX 77093
Eastex-Jensen NeighborhoodEstimated Value: $167,000 - $294,000
2
Beds
1
Bath
1,900
Sq Ft
$113/Sq Ft
Est. Value
About This Home
This home is located at 1802 Wellington St, Houston, TX 77093 and is currently estimated at $214,146, approximately $112 per square foot. 1802 Wellington St is a home located in Harris County with nearby schools including Coop Elementary School, Patrick Henry Middle School, and Sam Houston Math, Science & Technology Center.
Ownership History
Date
Name
Owned For
Owner Type
Purchase Details
Closed on
Dec 27, 2016
Sold by
Velazquez Ray and Velazquez Mercedes
Bought by
Velzquez Ray
Current Estimated Value
Purchase Details
Closed on
Jan 28, 2008
Sold by
Pittman Carl E and Pittman Marie
Bought by
Velazquez Ray A
Home Financials for this Owner
Home Financials are based on the most recent Mortgage that was taken out on this home.
Original Mortgage
$69,825
Outstanding Balance
$44,159
Interest Rate
6.11%
Mortgage Type
Purchase Money Mortgage
Estimated Equity
$169,987
Purchase Details
Closed on
Feb 28, 2002
Sold by
Hammonds Homes Ltd
Bought by
Rodriguez Leo
Home Financials for this Owner
Home Financials are based on the most recent Mortgage that was taken out on this home.
Original Mortgage
$214,300
Interest Rate
6.93%
Purchase Details
Closed on
Sep 22, 1995
Sold by
Pershall Wilma Lucille
Bought by
Bracamontes Jose Luis
Create a Home Valuation Report for This Property
The Home Valuation Report is an in-depth analysis detailing your home's value as well as a comparison with similar homes in the area
Home Values in the Area
Average Home Value in this Area
Purchase History
| Date | Buyer | Sale Price | Title Company |
|---|---|---|---|
| Velzquez Ray | -- | None Available | |
| Velazquez Ray A | -- | None Available | |
| Rodriguez Leo | -- | Stewart Title | |
| Bracamontes Jose Luis | -- | -- |
Source: Public Records
Mortgage History
| Date | Status | Borrower | Loan Amount |
|---|---|---|---|
| Open | Velazquez Ray A | $69,825 | |
| Previous Owner | Rodriguez Leo | $214,300 |
Source: Public Records
Tax History Compared to Growth
Tax History
| Year | Tax Paid | Tax Assessment Tax Assessment Total Assessment is a certain percentage of the fair market value that is determined by local assessors to be the total taxable value of land and additions on the property. | Land | Improvement |
|---|---|---|---|---|
| 2025 | $1,583 | $311,760 | $159,600 | $152,160 |
| 2024 | $1,583 | $192,824 | $113,925 | $78,899 |
| 2023 | $1,583 | $201,072 | $108,500 | $92,572 |
| 2022 | $2,660 | $146,705 | $73,625 | $73,080 |
| 2021 | $2,560 | $114,644 | $51,538 | $63,106 |
| 2020 | $2,418 | $104,497 | $51,538 | $52,959 |
| 2019 | $2,297 | $102,308 | $50,453 | $51,855 |
| 2018 | $1,441 | $56,965 | $37,200 | $19,765 |
| 2017 | $2,025 | $80,078 | $37,200 | $42,878 |
| 2016 | $1,983 | $80,078 | $37,200 | $42,878 |
| 2015 | $1,294 | $71,281 | $32,550 | $38,731 |
| 2014 | $1,294 | $71,281 | $32,550 | $38,731 |
Source: Public Records
Map
Nearby Homes
- 1731 Schilder Dr
- 9910 E Hardy Rd
- 1105 Soren Ln
- 9650 E Hardy Rd
- 10512 Exeter St
- 10514 Exeter St
- 2318 Cresline St
- 9634 Burden St
- 9630 Burden St
- 606 Cresline St
- 1002 Grenfell Ln
- 1829 Skinner Rd
- 2415 Goodloe St
- 513 Mayford St
- 2332 Margaret St
- 401 Cresline St
- 2315 Langley Rd
- 11018 Catamore St
- 2633 Hollis St
- 11026 Catamore St
- 1726 Wellington St
- 1724 Wellington St
- 1720 Wellington St
- 1803 Roxella St
- 1727 Roxella St
- 1807 Roxella St
- 1719 Roxella St
- 1816 Wellington St
- 1811 Roxella St
- 1727 Wellington St
- 1801 Wellington St
- 1712 Wellington St
- 1715 Roxella St
- 1721 Wellington St
- 1824 Wellington St
- 1710 Wellington St
- 1719 Wellington St
- 1819 Roxella St
- 1707 Roxella St
- 1819 Wellington St