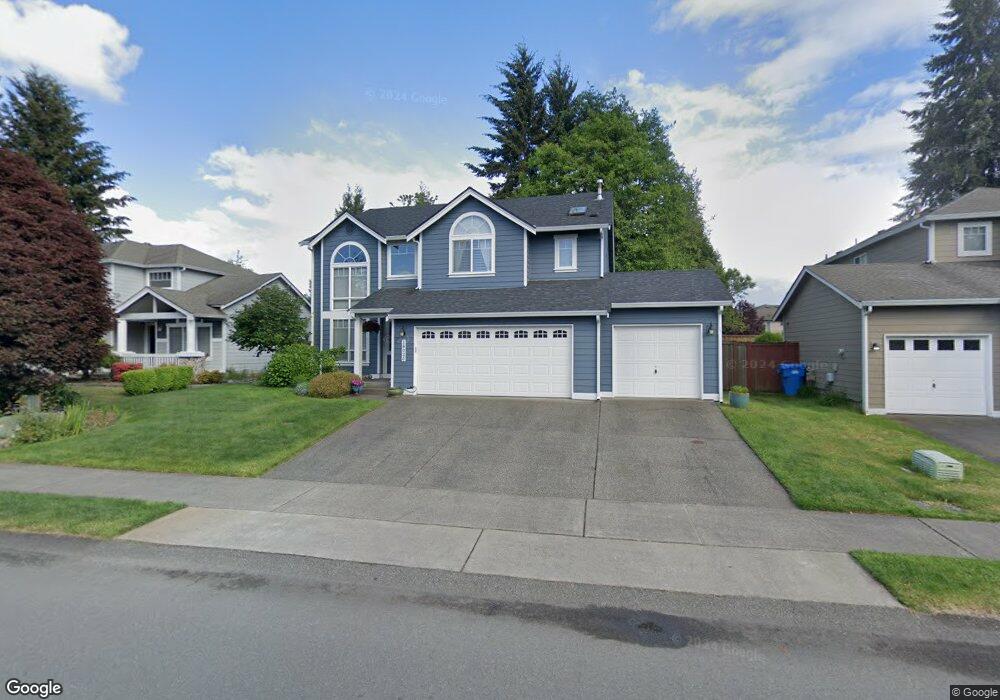
18025 90th Ave E Puyallup, WA 98375
Estimated Value: $572,000 - $612,000
4
Beds
3
Baths
1,975
Sq Ft
$299/Sq Ft
Est. Value
About This Home
This home is located at 18025 90th Ave E, Puyallup, WA 98375 and is currently estimated at $591,137, approximately $299 per square foot. 18025 90th Ave E is a home located in Pierce County with nearby schools including Emma L. Carson Elementary School, Stahl Junior High, and Gov. John Rogers High School.
Ownership History
Date
Name
Owned For
Owner Type
Purchase Details
Closed on
Apr 11, 2025
Sold by
Patterson Timothy J and Patterson Margaret C
Bought by
Living Trust and Patterson
Current Estimated Value
Purchase Details
Closed on
Mar 26, 2002
Sold by
Kornitzer Stephen O
Bought by
Patterson Timothy J and Patterson Margaret C
Home Financials for this Owner
Home Financials are based on the most recent Mortgage that was taken out on this home.
Original Mortgage
$173,057
Interest Rate
6.84%
Purchase Details
Closed on
Sep 19, 1997
Sold by
Henderson Homes Inc
Bought by
Kornitzer Stephen O and Kornitzer Theresa M
Home Financials for this Owner
Home Financials are based on the most recent Mortgage that was taken out on this home.
Original Mortgage
$163,800
Interest Rate
7.12%
Create a Home Valuation Report for This Property
The Home Valuation Report is an in-depth analysis detailing your home's value as well as a comparison with similar homes in the area
Home Values in the Area
Average Home Value in this Area
Purchase History
| Date | Buyer | Sale Price | Title Company |
|---|---|---|---|
| Living Trust | -- | None Listed On Document | |
| Patterson Timothy J | $192,500 | Chicago Title Insurance Co | |
| Kornitzer Stephen O | $172,450 | Chicago Title Insurance Co |
Source: Public Records
Mortgage History
| Date | Status | Borrower | Loan Amount |
|---|---|---|---|
| Previous Owner | Patterson Timothy J | $173,057 | |
| Previous Owner | Kornitzer Stephen O | $163,800 |
Source: Public Records
Tax History
| Year | Tax Paid | Tax Assessment Tax Assessment Total Assessment is a certain percentage of the fair market value that is determined by local assessors to be the total taxable value of land and additions on the property. | Land | Improvement |
|---|---|---|---|---|
| 2025 | $5,224 | $535,600 | $172,300 | $363,300 |
| 2024 | $5,224 | $514,800 | $166,100 | $348,700 |
| 2023 | $5,224 | $489,500 | $166,100 | $323,400 |
| 2022 | $5,090 | $519,800 | $169,800 | $350,000 |
| 2021 | $4,868 | $374,700 | $120,400 | $254,300 |
| 2019 | $4,331 | $328,100 | $105,000 | $223,100 |
| 2018 | $4,238 | $319,300 | $89,500 | $229,800 |
| 2017 | $3,887 | $284,800 | $77,800 | $207,000 |
| 2016 | $3,616 | $244,500 | $58,700 | $185,800 |
| 2014 | $3,229 | $219,700 | $43,900 | $175,800 |
| 2013 | $3,229 | $200,400 | $38,000 | $162,400 |
Source: Public Records
Map
Nearby Homes
- 8910 180th Street Ct E
- 8925 179th St E
- 9006 178th Street Ct E
- 18219 93rd Ave E
- 18529 94th Ave E
- 9016 176th Street Ct E
- 8715 185th Street Ct E
- 18401 95th Avenue Ct E
- 18634 94th Avenue Ct E
- 18114 97th Ave E
- 18708 94th Avenue Ct E
- 8524 186th Street Ct E
- 17801 97th Ln E
- 8709 188th Street Ct E
- 17317 94th Avenue Ct E
- 9547 187th Street Ct E
- 17209 92nd Ave E
- 17114 89th Avenue Ct E
- 8120 175th Street Ct E
- 8126 E 175th St
- 18021 90th Ave E
- 18029 90th Ave E
- 18033 90th Ave E
- 18017 90th Ave E
- 8930 180th Street Ct E
- 8930 180th Street Ct E
- 8930 180th St Ct E
- 8923 181st St E
- 18103 90th Ave E
- 18018 92nd Ave E
- 18022 92nd Ave E
- 18013 90th Ave E
- 8926 180th Street Ct E
- 18014 92nd Ave E
- 18026 92nd Ave E
- 8926 180th Street Ct E
- 8919 181st St E
- 18104 92nd Ave E
- 18010 92nd Ave E
- 18009 90th Ave E
Your Personal Tour Guide
Ask me questions while you tour the home.