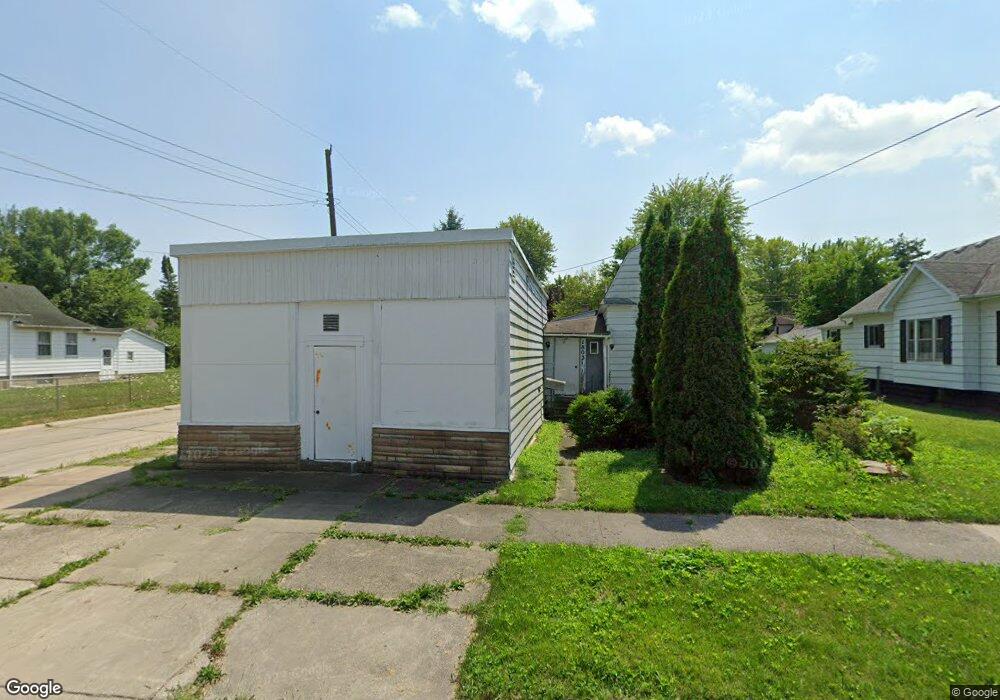
1803 Burnham St Saginaw, MI 48602
Southwest NeighborhoodEstimated Value: $61,929 - $80,000
4
Beds
2
Baths
1,926
Sq Ft
$37/Sq Ft
Est. Value
About This Home
This home is located at 1803 Burnham St, Saginaw, MI 48602 and is currently estimated at $71,310, approximately $37 per square foot. 1803 Burnham St is a home located in Saginaw County with nearby schools including Merrill Park Elementary School, Thompson Middle School, and Arthur Hill High School.
Ownership History
Date
Name
Owned For
Owner Type
Purchase Details
Closed on
Sep 16, 2025
Sold by
Navarrete Emma R and Navarrete Javier
Bought by
Navarrete Jose L
Current Estimated Value
Purchase Details
Closed on
Aug 24, 2025
Sold by
Federico Navarrete Revocable Living Trus and Navarrete Jose L
Bought by
Navarrete Emma R and Navarrete Javier
Purchase Details
Closed on
May 20, 2014
Sold by
Navarrete Jose L and Navarrete Federico
Bought by
Navarrete Jose L and Federico Navarrete Revocable Liv Trust
Purchase Details
Closed on
Mar 21, 2007
Sold by
D & L Associates Llp
Bought by
Navarrete Federico
Purchase Details
Closed on
Nov 27, 2006
Sold by
Bryce Peters Financial Corp
Bought by
D & L Associates Llp
Purchase Details
Closed on
Oct 27, 2006
Sold by
Nationstar Mortgage Llc
Bought by
Bryce Peters Financial Corp
Purchase Details
Closed on
Feb 17, 2006
Sold by
Brewer Stephen
Bought by
Centex Home Equity Co
Purchase Details
Closed on
Mar 6, 1998
Sold by
Brewer Sylvester A
Bought by
Brewer Stephen
Purchase Details
Closed on
Mar 1, 1998
Create a Home Valuation Report for This Property
The Home Valuation Report is an in-depth analysis detailing your home's value as well as a comparison with similar homes in the area
Home Values in the Area
Average Home Value in this Area
Purchase History
| Date | Buyer | Sale Price | Title Company |
|---|---|---|---|
| Navarrete Jose L | -- | None Listed On Document | |
| Navarrete Emma R | -- | None Listed On Document | |
| Navarrete Jose L | -- | -- | |
| Navarrete Federico | $8,000 | -- | |
| D & L Associates Llp | $3,500 | -- | |
| Bryce Peters Financial Corp | -- | -- | |
| Centex Home Equity Co | -- | -- | |
| Brewer Stephen | $20,000 | -- | |
| -- | $20,000 | -- |
Source: Public Records
Tax History Compared to Growth
Tax History
| Year | Tax Paid | Tax Assessment Tax Assessment Total Assessment is a certain percentage of the fair market value that is determined by local assessors to be the total taxable value of land and additions on the property. | Land | Improvement |
|---|---|---|---|---|
| 2025 | $847 | $1,100 | $0 | $0 |
| 2024 | $692 | $16,600 | $0 | $0 |
| 2023 | $665 | $14,700 | $0 | $0 |
| 2022 | $777 | $12,700 | $0 | $0 |
| 2021 | $731 | $11,900 | $0 | $0 |
| 2020 | $638 | $10,600 | $0 | $0 |
| 2019 | $640 | $9,900 | $700 | $9,200 |
| 2018 | $502 | $9,204 | $0 | $0 |
| 2017 | $577 | $8,900 | $0 | $0 |
| 2016 | $573 | $8,857 | $0 | $0 |
| 2014 | -- | $9,170 | $0 | $8,497 |
| 2013 | -- | $9,531 | $0 | $0 |
Source: Public Records
Map
Nearby Homes
- 1817 Ring St
- 1823 Ring St
- 1924 Wood St
- 1843 Kendrick St
- 1916 Joslin St
- 1914 Joslin St
- 1725 Kendrick St
- 1306 S Wheeler St
- 1756 Jordan St
- 1830 Jordan St
- 1918 Stanley St
- 1716 Maple St
- 2300 Jerome St
- 1652 Stanley St
- 2219 S Michigan Ave
- 1919 Grout St
- 2116 Wood St
- 819 Grove St
- 2116 W Michigan Ave
- 1723 Maine St