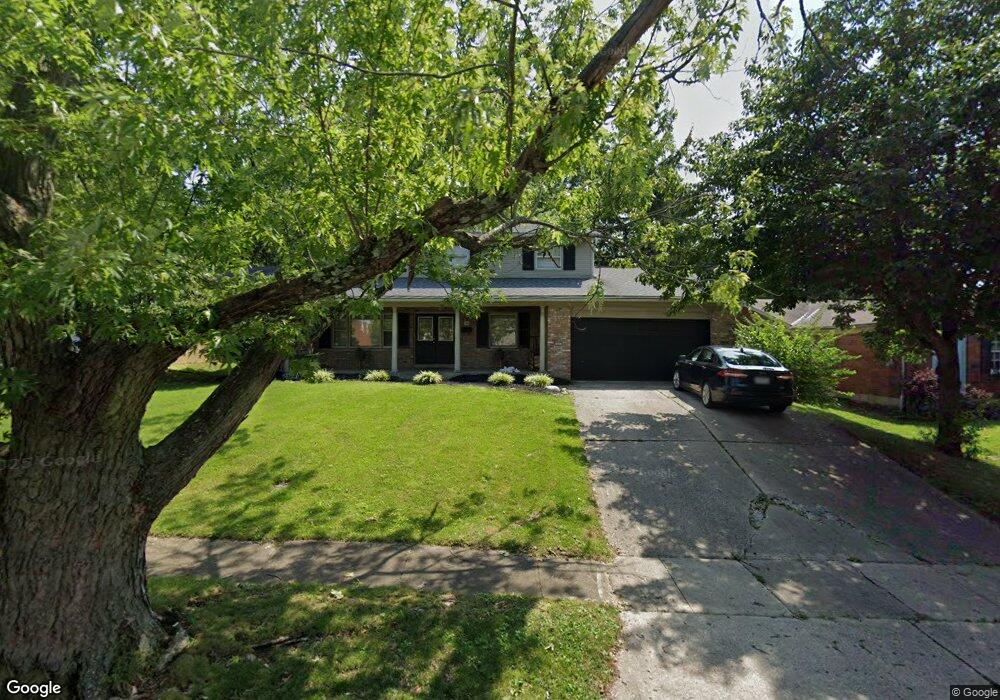
1803 Clayburn Cir Cincinnati, OH 45240
Pleasant Run Farms NeighborhoodEstimated Value: $298,944 - $357,000
4
Beds
4
Baths
2,108
Sq Ft
$155/Sq Ft
Est. Value
About This Home
This home is located at 1803 Clayburn Cir, Cincinnati, OH 45240 and is currently estimated at $325,986, approximately $154 per square foot. 1803 Clayburn Cir is a home located in Hamilton County with nearby schools including Pleasant Run Elementary School, Pleasant Run Middle School, and Northwest High School.
Ownership History
Date
Name
Owned For
Owner Type
Purchase Details
Closed on
Mar 1, 2001
Sold by
Keinath Dea
Bought by
Miller Joe E
Current Estimated Value
Purchase Details
Closed on
Jun 16, 1999
Sold by
Wogenstahl William D and Wogenstahl Julie A
Bought by
Miller Joe E
Home Financials for this Owner
Home Financials are based on the most recent Mortgage that was taken out on this home.
Original Mortgage
$125,100
Interest Rate
7.06%
Create a Home Valuation Report for This Property
The Home Valuation Report is an in-depth analysis detailing your home's value as well as a comparison with similar homes in the area
Home Values in the Area
Average Home Value in this Area
Purchase History
| Date | Buyer | Sale Price | Title Company |
|---|---|---|---|
| Miller Joe E | -- | -- | |
| Miller Joe E | $139,000 | Blue Chip Title Agency Inc |
Source: Public Records
Mortgage History
| Date | Status | Borrower | Loan Amount |
|---|---|---|---|
| Previous Owner | Miller Joe E | $125,100 |
Source: Public Records
Tax History Compared to Growth
Tax History
| Year | Tax Paid | Tax Assessment Tax Assessment Total Assessment is a certain percentage of the fair market value that is determined by local assessors to be the total taxable value of land and additions on the property. | Land | Improvement |
|---|---|---|---|---|
| 2024 | $5,096 | $83,969 | $12,509 | $71,460 |
| 2023 | $4,838 | $83,969 | $12,509 | $71,460 |
| 2022 | $4,654 | $64,817 | $10,829 | $53,988 |
| 2021 | $4,607 | $64,817 | $10,829 | $53,988 |
| 2020 | $4,664 | $64,817 | $10,829 | $53,988 |
| 2019 | $3,940 | $51,853 | $8,663 | $43,190 |
| 2018 | $3,562 | $51,853 | $8,663 | $43,190 |
| 2017 | $3,381 | $51,853 | $8,663 | $43,190 |
| 2016 | $3,302 | $49,743 | $9,433 | $40,310 |
| 2015 | $3,338 | $49,743 | $9,433 | $40,310 |
| 2014 | $3,345 | $49,743 | $9,433 | $40,310 |
| 2013 | $3,324 | $50,757 | $9,625 | $41,132 |
Source: Public Records
Map
Nearby Homes
- 1810 W Kemper Rd
- 1863 W Kemper Rd
- 11825 Cedarcreek Dr
- 11728 Elkwood Dr
- 11872 Elmgrove Cir
- 11666 Elkwood Dr
- 1639 W Kemper Rd
- 1923 Centerbrook Ct
- 11897 Winston Cir
- 2188 Broadhurst Ave
- 12057 Brookway Dr
- 12052 Doe Run Ct
- 11505 Oxfordshire Ln
- 11478 Ramondi Place
- 1373 Forester Dr
- 11537 Norbourne Dr
- 1352 Forester Dr
- 1442 Hazelgrove Dr
- 12080 Regency Run Ct Unit 4
- 32 Dusk Ct
- 1795 Clayburn Cir
- 1811 Clayburn Cir
- 1787 Clayburn Cir
- 1823 Clayburn Cir
- 1800 W Kemper Rd
- 1794 Clayburn Cir
- 1816 W Kemper Rd
- 1802 Clayburn Cir
- 1779 Clayburn Cir
- 1786 Clayburn Cir
- 1792 W Kemper Rd
- 1810 Clayburn Cir
- 1829 Clayburn Cir
- 1778 Clayburn Cir
- 1828 W Kemper Rd
- 1784 W Kemper Rd
- 1771 Clayburn Cir
- 11858 Canfield Ct
- 1832 Clayburn Cir
- 1770 Clayburn Cir