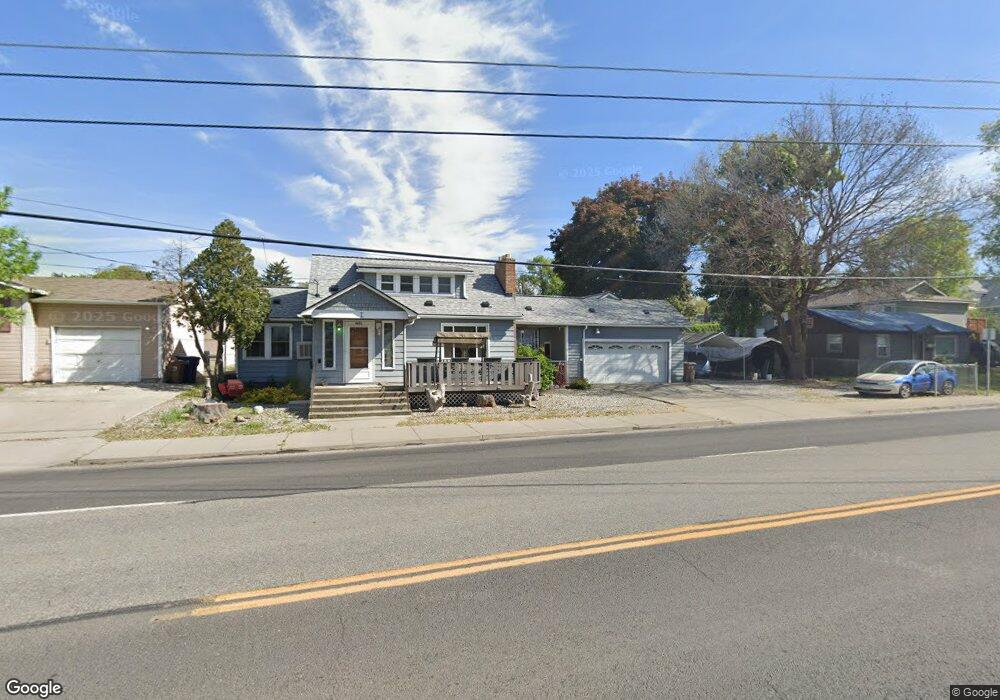
1803 E North Foothills Dr Spokane, WA 99207
Bemiss NeighborhoodEstimated Value: $268,928 - $302,000
3
Beds
1
Bath
1,236
Sq Ft
$231/Sq Ft
Est. Value
About This Home
This home is located at 1803 E North Foothills Dr, Spokane, WA 99207 and is currently estimated at $285,732, approximately $231 per square foot. 1803 E North Foothills Dr is a home located in Spokane County with nearby schools including Bemiss Elementary School, Shaw Middle School, and Rogers High School.
Ownership History
Date
Name
Owned For
Owner Type
Purchase Details
Closed on
Dec 15, 1997
Sold by
Harder Duane Henry
Bought by
Dobler Keith R and Dobler Carol Ann K
Current Estimated Value
Home Financials for this Owner
Home Financials are based on the most recent Mortgage that was taken out on this home.
Original Mortgage
$59,925
Outstanding Balance
$13,363
Interest Rate
10.75%
Estimated Equity
$272,369
Purchase Details
Closed on
Nov 6, 1997
Sold by
Harder Richard Marvin
Bought by
Harder Duane Henry
Home Financials for this Owner
Home Financials are based on the most recent Mortgage that was taken out on this home.
Original Mortgage
$59,925
Outstanding Balance
$13,363
Interest Rate
10.75%
Estimated Equity
$272,369
Purchase Details
Closed on
Jan 30, 1997
Sold by
Harder Duane H and Rounds Ethel V
Bought by
Harder Duane H and Harder Richard M
Create a Home Valuation Report for This Property
The Home Valuation Report is an in-depth analysis detailing your home's value as well as a comparison with similar homes in the area
Home Values in the Area
Average Home Value in this Area
Purchase History
| Date | Buyer | Sale Price | Title Company |
|---|---|---|---|
| Dobler Keith R | $79,900 | Transnation Title Ins Co | |
| Harder Duane Henry | -- | Transnation Title Insurance | |
| Harder Duane H | -- | -- |
Source: Public Records
Mortgage History
| Date | Status | Borrower | Loan Amount |
|---|---|---|---|
| Open | Dobler Keith R | $59,925 | |
| Closed | Dobler Keith R | $19,975 |
Source: Public Records
Tax History Compared to Growth
Tax History
| Year | Tax Paid | Tax Assessment Tax Assessment Total Assessment is a certain percentage of the fair market value that is determined by local assessors to be the total taxable value of land and additions on the property. | Land | Improvement |
|---|---|---|---|---|
| 2025 | $2,432 | $229,300 | $75,000 | $154,300 |
| 2024 | $2,432 | $244,600 | $70,000 | $174,600 |
| 2023 | $2,234 | $235,600 | $65,000 | $170,600 |
| 2022 | $1,982 | $227,900 | $60,000 | $167,900 |
| 2021 | $1,645 | $137,800 | $22,000 | $115,800 |
| 2020 | $1,397 | $112,600 | $22,000 | $90,600 |
| 2019 | $1,247 | $104,000 | $20,000 | $84,000 |
| 2018 | $1,344 | $96,300 | $18,000 | $78,300 |
| 2017 | $1,242 | $90,600 | $18,000 | $72,600 |
| 2016 | $1,152 | $82,200 | $18,000 | $64,200 |
| 2015 | $1,106 | $77,200 | $18,000 | $59,200 |
| 2014 | -- | $74,600 | $18,000 | $56,600 |
| 2013 | -- | $0 | $0 | $0 |
Source: Public Records
Map
Nearby Homes
- 1743 E Dalton Ave
- 1807 E Liberty Ave
- 1624 E Liberty Ave
- 1651 N Foothills Dr E
- 2921 E Fairview Ave
- 3024 N Hogan St
- 407 E Cleveland Ave
- 3002 N Crestline St
- 2923 N Hogan St
- 2117 E Euclid Ave Unit 2119 E Euclid Ave
- 1418 E Dalton Ave
- 1825 E Glass Ave
- 2820 N Perry St
- 2617 N Pittsburg St
- 1914 E Gordon Ave
- 3414 N Lee St
- 2817 N Stone St
- 2714 N Lee St
- 1924 E Marietta Ave
- 1222 E Marietta Ave
- 1742 E Dalton Ave
- 1811 E North Foothills Dr
- 1738 E Dalton Ave
- 1811 N Foothills Dr E
- 1816 E Dalton Ave
- 1734 E Dalton Ave
- 1801 E Dalton Ave
- 1803 E Dalton Ave
- 1728 E Dalton Ave
- 1822 E Dalton Ave
- 1737 E Dalton Ave
- 1809 E Dalton Ave
- 3010 N Magnolia St
- 3013 N Magnolia St
- 1815 E Dalton Ave
- 1731 E Dalton Ave
- 1826 E Dalton Ave
- 3015 N Napa St
- 1803 E Fairview Ave
- 1827 E Dalton Ave