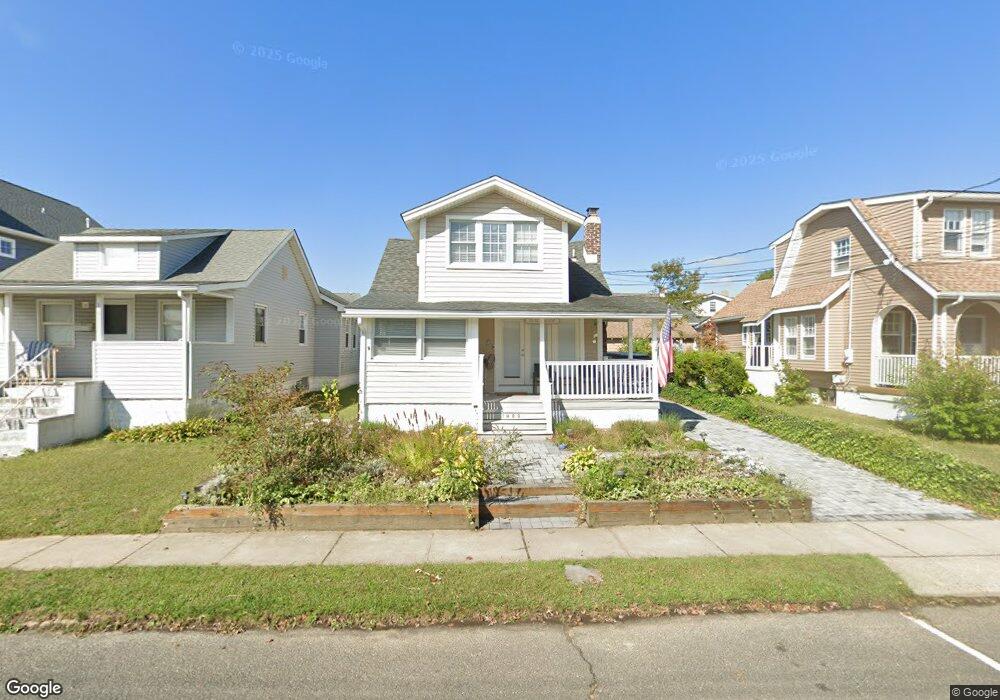
1803 Snyder Ave Unit Front SUMMER Belmar, NJ 07719
Estimated Value: $1,041,000 - $1,254,000
3
Beds
2
Baths
904
Sq Ft
$1,290/Sq Ft
Est. Value
About This Home
This home is located at 1803 Snyder Ave Unit Front SUMMER, Belmar, NJ 07719 and is currently estimated at $1,166,545, approximately $1,290 per square foot. 1803 Snyder Ave Unit Front SUMMER is a home located in Monmouth County with nearby schools including Belmar Elementary School, St. Rose Grammar School, and St Rose High School.
Ownership History
Date
Name
Owned For
Owner Type
Purchase Details
Closed on
Jan 13, 2025
Sold by
Lee Chang J and Lee Myong H
Bought by
Durney Mark T
Current Estimated Value
Home Financials for this Owner
Home Financials are based on the most recent Mortgage that was taken out on this home.
Original Mortgage
$587,500
Outstanding Balance
$583,252
Interest Rate
6.6%
Mortgage Type
New Conventional
Estimated Equity
$583,293
Purchase Details
Closed on
Jul 22, 2020
Sold by
Stefanowicz Robert
Bought by
Lee Chang J and Lee Myong H
Purchase Details
Closed on
Apr 15, 2005
Sold by
Doris Vorpagel Estate
Bought by
Steefanowicz Robert
Home Financials for this Owner
Home Financials are based on the most recent Mortgage that was taken out on this home.
Original Mortgage
$400,000
Interest Rate
6.05%
Mortgage Type
New Conventional
Create a Home Valuation Report for This Property
The Home Valuation Report is an in-depth analysis detailing your home's value as well as a comparison with similar homes in the area
Home Values in the Area
Average Home Value in this Area
Purchase History
| Date | Buyer | Sale Price | Title Company |
|---|---|---|---|
| Durney Mark T | $1,175,000 | Old Republic Title | |
| Lee Chang J | $713,000 | Westcor Land Title Ins Co | |
| Steefanowicz Robert | $500,000 | -- |
Source: Public Records
Mortgage History
| Date | Status | Borrower | Loan Amount |
|---|---|---|---|
| Open | Durney Mark T | $587,500 | |
| Previous Owner | Steefanowicz Robert | $400,000 |
Source: Public Records
Tax History Compared to Growth
Tax History
| Year | Tax Paid | Tax Assessment Tax Assessment Total Assessment is a certain percentage of the fair market value that is determined by local assessors to be the total taxable value of land and additions on the property. | Land | Improvement |
|---|---|---|---|---|
| 2025 | $7,770 | $534,000 | $369,600 | $164,400 |
| 2024 | $7,508 | $534,000 | $369,600 | $164,400 |
| 2023 | $7,508 | $534,000 | $369,600 | $164,400 |
| 2022 | $7,246 | $534,000 | $369,600 | $164,400 |
| 2021 | $6,878 | $534,000 | $369,600 | $164,400 |
| 2020 | $6,878 | $511,400 | $369,600 | $141,800 |
| 2019 | $6,878 | $511,400 | $369,600 | $141,800 |
| 2018 | $6,316 | $511,400 | $369,600 | $141,800 |
| 2017 | $6,162 | $511,400 | $369,600 | $141,800 |
| 2016 | $6,501 | $340,200 | $229,600 | $110,600 |
| 2015 | $6,145 | $320,200 | $209,600 | $110,600 |
| 2014 | $5,809 | $300,200 | $189,600 | $110,600 |
Source: Public Records
Map
Nearby Homes
- 1803 Snyder Ave Unit WINTER_FRONT
- 1803 Snyder Ave Unit WINTER- Cottage
- 1803 Snyder Ave Unit SUMMER- Cottage
- 1803 Snyder Ave Unit FRONT
- 1805 Snyder Ave
- 1801 Snyder Ave
- 1807 Snyder Ave
- 1807 Snyder Ave Unit 1
- 1807 Snyder Ave Unit 2
- 215 18th Ave
- 1802 Snyder Ave
- 217 18th Ave
- 207 18th Ave
- 1809 Snyder Ave
- 1804 Snyder Ave
- 1802 B St
- 1806 Snyder Ave
- 219 18th Ave
- 1808 Snyder Ave
- 205 18th Ave Unit Front