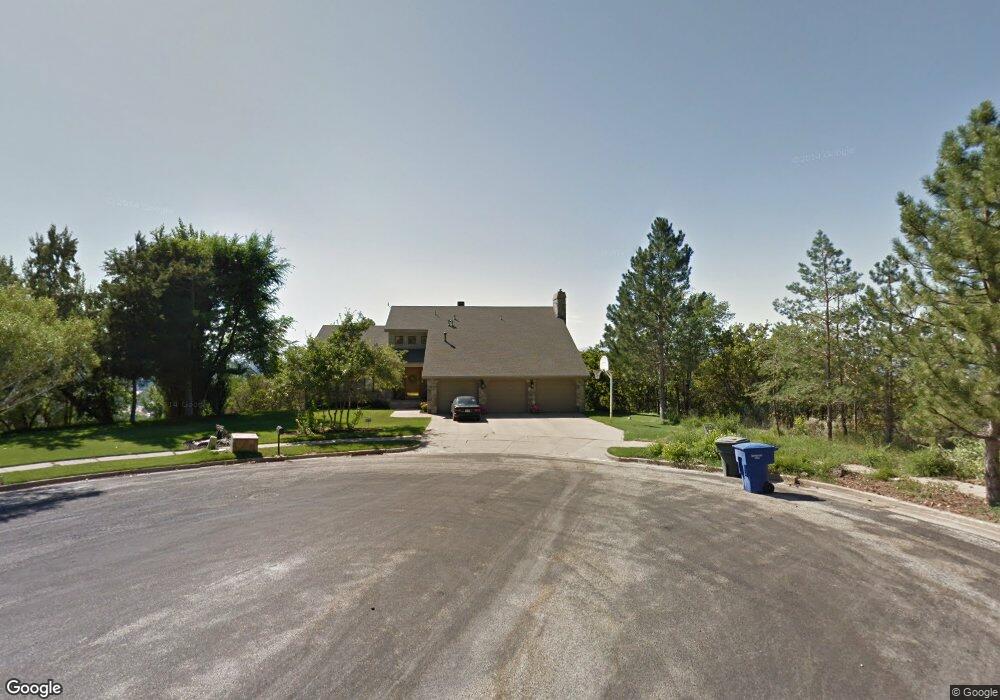
1803 Valley View Cir Ogden, UT 84403
Southeast Ogden NeighborhoodEstimated Value: $820,000 - $1,049,921
5
Beds
2
Baths
3,302
Sq Ft
$282/Sq Ft
Est. Value
About This Home
This home is located at 1803 Valley View Cir, Ogden, UT 84403 and is currently estimated at $931,230, approximately $282 per square foot. 1803 Valley View Cir is a home located in Weber County with nearby schools including Shadow Valley School, Mount Ogden Junior High School, and Ogden High School.
Ownership History
Date
Name
Owned For
Owner Type
Purchase Details
Closed on
Jul 10, 2023
Sold by
Gilbert L And Sherrie A Craig Revocable
Bought by
Leatham Tanner J
Current Estimated Value
Home Financials for this Owner
Home Financials are based on the most recent Mortgage that was taken out on this home.
Original Mortgage
$485,000
Outstanding Balance
$472,950
Interest Rate
6.57%
Mortgage Type
New Conventional
Estimated Equity
$458,280
Purchase Details
Closed on
Apr 20, 2022
Sold by
David M And Linda Steed Revocable Living
Bought by
Gilbert L And Sherrie A Craig Revocable Livin
Purchase Details
Closed on
Nov 6, 2002
Sold by
Steed David M and Steed Linda S
Bought by
Steed David M and Steed Linda
Home Financials for this Owner
Home Financials are based on the most recent Mortgage that was taken out on this home.
Original Mortgage
$95,500
Interest Rate
5.88%
Create a Home Valuation Report for This Property
The Home Valuation Report is an in-depth analysis detailing your home's value as well as a comparison with similar homes in the area
Home Values in the Area
Average Home Value in this Area
Purchase History
| Date | Buyer | Sale Price | Title Company |
|---|---|---|---|
| Leatham Tanner J | -- | Old Republic Title | |
| Gilbert L And Sherrie A Craig Revocable Livin | -- | Steed Title | |
| Steed David M | -- | Mountain View Title |
Source: Public Records
Mortgage History
| Date | Status | Borrower | Loan Amount |
|---|---|---|---|
| Open | Leatham Tanner J | $485,000 | |
| Previous Owner | Steed David M | $95,500 |
Source: Public Records
Tax History Compared to Growth
Tax History
| Year | Tax Paid | Tax Assessment Tax Assessment Total Assessment is a certain percentage of the fair market value that is determined by local assessors to be the total taxable value of land and additions on the property. | Land | Improvement |
|---|---|---|---|---|
| 2025 | $7,094 | $966,889 | $260,420 | $706,469 |
| 2024 | $6,968 | $518,548 | $143,131 | $375,417 |
| 2023 | $6,015 | $450,900 | $143,131 | $307,769 |
| 2022 | $5,521 | $413,600 | $111,323 | $302,277 |
| 2021 | $5,315 | $661,000 | $135,500 | $525,500 |
| 2020 | $5,043 | $579,000 | $112,000 | $467,000 |
| 2019 | $5,020 | $543,999 | $107,000 | $436,999 |
| 2018 | $4,495 | $482,000 | $102,000 | $380,000 |
| 2017 | $4,734 | $479,999 | $92,000 | $387,999 |
| 2016 | $4,389 | $242,825 | $55,200 | $187,625 |
| 2015 | $3,453 | $186,190 | $55,200 | $130,990 |
| 2014 | $3,580 | $191,791 | $55,200 | $136,591 |
Source: Public Records
Map
Nearby Homes
- 4288 Fern Dr
- 4253 Taylor Ave
- 1788 E Seven Oaks Ln
- 4781 Canterbury Rd
- 4849 Nightingale Ln
- 4857 Chukar Ln
- 4858 Nightingale Ln Unit 72
- 1419 36th St
- 4843 S Nightingale
- 4864 Nightingale Ln Unit 71
- 1860 Wasatch Dr
- 1681 E Lakeview Way
- 1113 Country Hills Dr Unit G2
- 4983 Quail Ln
- 1663 Navajo Dr
- 5056 Skyline Pkwy
- 1762 Whispering Oaks Dr
- 4065 Eccles Ave
- 5210 Skyline Pkwy
- 5028 S Ridgedale Dr
- 1812 Valley View Cir
- 1767 Hillside Cir
- 4196 Bona Villa Dr
- 1761 Hillside Cir
- 1821 Valley View Cir
- 1755 Bona Villa Dr
- 1823 Valley View Cir
- 1812 Beus Dr
- 4185 Beus Dr
- 1796 Beus Dr
- 4184 S Bona Villa Dr E Unit 32
- 4170 Bona Villa Dr
- 0 Hillside Cir Unit 575621
- 0 Hillside Cir Unit 27
- 1749 Hillside Cir
- 4157 Beus Dr
- 4157 Beus Dr Unit 51
- 1747 Bona Villa Dr
- 1747 Bona Villa Dr Unit 35
- 1747 Bona Villa Dr Unit 34