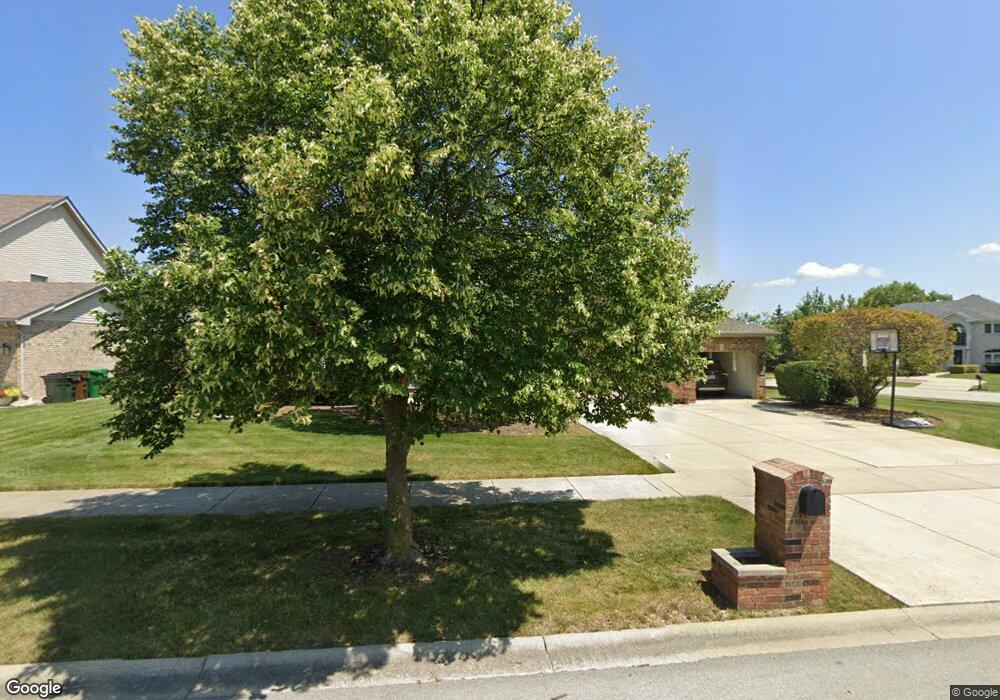
18031 Pelican Dr Tinley Park, IL 60487
Central Tinley Park NeighborhoodEstimated Value: $576,924 - $640,000
4
Beds
3
Baths
3,450
Sq Ft
$174/Sq Ft
Est. Value
About This Home
This home is located at 18031 Pelican Dr, Tinley Park, IL 60487 and is currently estimated at $600,481, approximately $174 per square foot. 18031 Pelican Dr is a home located in Cook County with nearby schools including Millennium Elementary School, Prairie View Middle School, and Victor J Andrew High School.
Ownership History
Date
Name
Owned For
Owner Type
Purchase Details
Closed on
Dec 2, 2014
Sold by
Kutom Rulla
Bought by
Kutom Raed and Kutom Rulla
Current Estimated Value
Purchase Details
Closed on
Jul 23, 2010
Sold by
Mikucki Thomas J
Bought by
Kutom Rulla B
Home Financials for this Owner
Home Financials are based on the most recent Mortgage that was taken out on this home.
Original Mortgage
$344,000
Outstanding Balance
$229,619
Interest Rate
4.81%
Mortgage Type
Unknown
Estimated Equity
$370,862
Purchase Details
Closed on
Jun 19, 1998
Sold by
State Bank Of Countryside
Bought by
Mikucki Thomas J and Mikucki Martha J
Home Financials for this Owner
Home Financials are based on the most recent Mortgage that was taken out on this home.
Original Mortgage
$200,000
Interest Rate
7.15%
Purchase Details
Closed on
Apr 1, 1998
Sold by
Heritage Trust Company
Bought by
State Bank Of Countryside and Trust #87-230
Home Financials for this Owner
Home Financials are based on the most recent Mortgage that was taken out on this home.
Original Mortgage
$70,000
Interest Rate
7.18%
Create a Home Valuation Report for This Property
The Home Valuation Report is an in-depth analysis detailing your home's value as well as a comparison with similar homes in the area
Home Values in the Area
Average Home Value in this Area
Purchase History
| Date | Buyer | Sale Price | Title Company |
|---|---|---|---|
| Kutom Raed | -- | None Available | |
| Kutom Rulla B | $430,000 | Fidelity | |
| Mikucki Thomas J | $295,500 | -- | |
| State Bank Of Countryside | $75,000 | -- |
Source: Public Records
Mortgage History
| Date | Status | Borrower | Loan Amount |
|---|---|---|---|
| Open | Kutom Rulla B | $344,000 | |
| Previous Owner | Mikucki Thomas J | $200,000 | |
| Previous Owner | State Bank Of Countryside | $70,000 |
Source: Public Records
Tax History Compared to Growth
Tax History
| Year | Tax Paid | Tax Assessment Tax Assessment Total Assessment is a certain percentage of the fair market value that is determined by local assessors to be the total taxable value of land and additions on the property. | Land | Improvement |
|---|---|---|---|---|
| 2024 | $12,406 | $46,236 | $16,172 | $30,064 |
| 2023 | $9,847 | $48,000 | $16,172 | $31,828 |
| 2022 | $9,847 | $31,040 | $6,976 | $24,064 |
| 2021 | $9,561 | $31,039 | $6,976 | $24,063 |
| 2020 | $10,279 | $33,689 | $6,976 | $26,713 |
| 2019 | $9,233 | $31,898 | $6,342 | $25,556 |
| 2018 | $9,865 | $34,518 | $6,342 | $28,176 |
| 2017 | $9,621 | $34,518 | $6,342 | $28,176 |
| 2016 | $8,926 | $29,374 | $5,707 | $23,667 |
| 2015 | $9,943 | $32,886 | $5,707 | $27,179 |
| 2014 | $10,618 | $35,164 | $5,707 | $29,457 |
| 2013 | $9,016 | $32,481 | $5,707 | $26,774 |
Source: Public Records
Map
Nearby Homes
- 9038 Mansfield Dr Unit 8
- 9051 Mansfield Dr Unit 1
- 18261 Kirby Dr Unit 2918261
- 18055 Upland Dr
- 8423 Stratford Dr Unit 8423
- 8416 Stratford Dr Unit 8416
- 17631 Dover Ct
- 17964 Upland Dr
- 18248 Murphy Cir Unit 182
- Fremont Plan at Radcliffe Place
- Calysta Plan at Radcliffe Place
- Danbury Plan at Radcliffe Place
- Briarcliffe Plan at Radcliffe Place
- Eden Plan at Radcliffe Place
- Amberwood Plan at Radcliffe Place
- 17533 Pecan Ln
- 9280 Windsor Pkwy Unit 92
- 9260 Windsor Pkwy Unit 80
- 9201 175th St
- 17324 Humber Ln
- 18025 Pelican Dr
- 18024 Flamingo Dr
- 8819 Flamingo Dr
- 18030 Pelican Dr
- 18019 Pelican Ln
- 18019 Pelican Dr
- 8825 Flamingo Dr
- 18024 Pelican Dr
- 18018 Flamingo Dr
- 8831 Flamingo Dr
- 18018 Pelican Dr
- 18106 Hummingbird Dr
- 18013 Pelican Dr
- 18031 Flamingo Dr
- 8901 Flamingo Dr
- 18037 Hummingbird Dr
- 18031 Cardinal Ln
- 18012 Flamingo Dr
- 18025 Cardinal Ln
- 8816 Mallard Rd