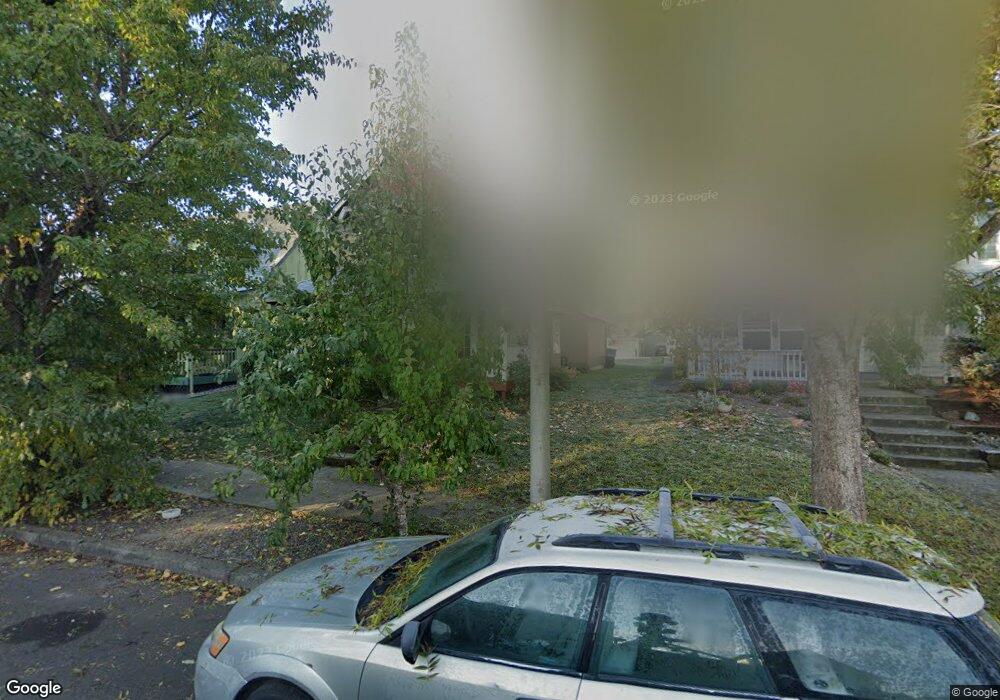
1804 E 38th Loop Vancouver, WA 98663
Rose Village NeighborhoodEstimated Value: $396,000 - $423,075
3
Beds
3
Baths
1,305
Sq Ft
$312/Sq Ft
Est. Value
About This Home
This home is located at 1804 E 38th Loop, Vancouver, WA 98663 and is currently estimated at $406,769, approximately $311 per square foot. 1804 E 38th Loop is a home located in Clark County with nearby schools including Washington Elementary School, Discovery Middle School, and Hudson's Bay High School.
Ownership History
Date
Name
Owned For
Owner Type
Purchase Details
Closed on
Jul 8, 2014
Sold by
Fannie Mae
Bought by
Domer Michael and Domer Meri
Current Estimated Value
Home Financials for this Owner
Home Financials are based on the most recent Mortgage that was taken out on this home.
Original Mortgage
$132,000
Outstanding Balance
$100,318
Interest Rate
4.1%
Mortgage Type
New Conventional
Estimated Equity
$306,451
Purchase Details
Closed on
Apr 15, 2013
Sold by
Bournelis John P and Bournelis Hannah
Bought by
Federal National Mortgage Association
Purchase Details
Closed on
Oct 11, 2007
Sold by
Locke Crystal R and Locke Jeffrey A
Bought by
Bournelis John and Bournelis Hannah
Home Financials for this Owner
Home Financials are based on the most recent Mortgage that was taken out on this home.
Original Mortgage
$210,390
Interest Rate
6.4%
Mortgage Type
Purchase Money Mortgage
Purchase Details
Closed on
Nov 18, 2005
Sold by
Butts Daniel C and Butts Faith M
Bought by
Butts Daniel C and Butts Faith M
Purchase Details
Closed on
Sep 9, 2005
Sold by
Butts James M and Mcdermott Carri
Bought by
Locke Jeffrey A and Locke Crystal R
Home Financials for this Owner
Home Financials are based on the most recent Mortgage that was taken out on this home.
Original Mortgage
$40,200
Interest Rate
5.81%
Mortgage Type
Stand Alone Second
Purchase Details
Closed on
Jul 8, 2003
Sold by
Butts Daniel C and Butts Faith M
Bought by
Butts James M and Mcdermott Carri
Home Financials for this Owner
Home Financials are based on the most recent Mortgage that was taken out on this home.
Original Mortgage
$121,200
Interest Rate
4.12%
Mortgage Type
Purchase Money Mortgage
Purchase Details
Closed on
Mar 16, 1998
Sold by
Center Monty L and Center Julie A
Bought by
Mendenhall Craig Scott
Home Financials for this Owner
Home Financials are based on the most recent Mortgage that was taken out on this home.
Original Mortgage
$116,249
Interest Rate
7.02%
Create a Home Valuation Report for This Property
The Home Valuation Report is an in-depth analysis detailing your home's value as well as a comparison with similar homes in the area
Home Values in the Area
Average Home Value in this Area
Purchase History
| Date | Buyer | Sale Price | Title Company |
|---|---|---|---|
| Domer Michael | -- | Clark County Title Co | |
| Federal National Mortgage Association | $176,517 | None Available | |
| Bournelis John | $216,900 | Cascade Title | |
| Butts Daniel C | -- | Clark County Title Co | |
| Locke Jeffrey A | $201,000 | Cascade Title | |
| Butts James M | $135,000 | Fidelity National Title | |
| Mendenhall Craig Scott | $117,561 | Clark County Title Company |
Source: Public Records
Mortgage History
| Date | Status | Borrower | Loan Amount |
|---|---|---|---|
| Open | Domer Michael | $132,000 | |
| Previous Owner | Bournelis John | $210,390 | |
| Previous Owner | Locke Jeffrey A | $40,200 | |
| Previous Owner | Locke Jeffrey A | $160,800 | |
| Previous Owner | Butts James M | $121,200 | |
| Previous Owner | Mendenhall Craig Scott | $116,249 |
Source: Public Records
Tax History
| Year | Tax Paid | Tax Assessment Tax Assessment Total Assessment is a certain percentage of the fair market value that is determined by local assessors to be the total taxable value of land and additions on the property. | Land | Improvement |
|---|---|---|---|---|
| 2025 | $3,387 | $329,896 | $144,000 | $185,896 |
| 2024 | $3,189 | $346,599 | $144,000 | $202,599 |
| 2023 | $3,117 | $340,567 | $142,800 | $197,767 |
| 2022 | $2,884 | $334,296 | $139,200 | $195,096 |
| 2021 | $2,904 | $288,122 | $120,000 | $168,122 |
| 2020 | $2,648 | $273,556 | $112,750 | $160,806 |
| 2019 | $2,372 | $258,420 | $99,550 | $158,870 |
| 2018 | $2,454 | $239,782 | $0 | $0 |
| 2017 | $2,096 | $205,975 | $0 | $0 |
| 2016 | $1,940 | $183,598 | $0 | $0 |
Source: Public Records
Map
Nearby Homes
Your Personal Tour Guide
Ask me questions while you tour the home.