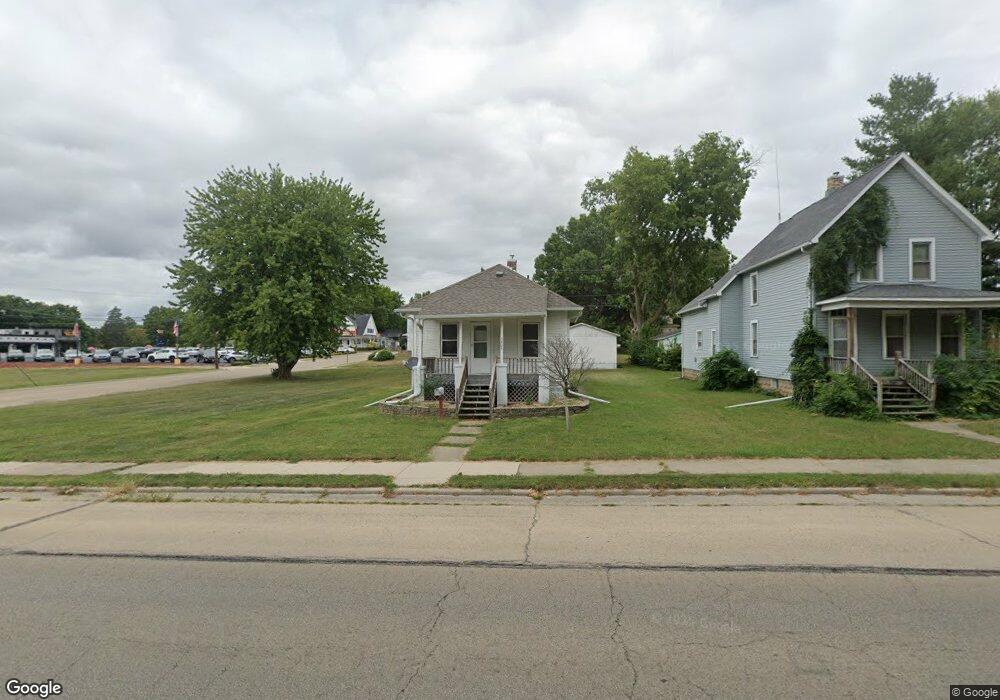
1804 E 3rd St Sterling, IL 61081
Estimated Value: $68,140 - $82,000
2
Beds
1
Bath
610
Sq Ft
$122/Sq Ft
Est. Value
About This Home
This home is located at 1804 E 3rd St, Sterling, IL 61081 and is currently estimated at $74,535, approximately $122 per square foot. 1804 E 3rd St is a home located in Whiteside County with nearby schools including Christ Lutheran School and St. Mary's School.
Ownership History
Date
Name
Owned For
Owner Type
Purchase Details
Closed on
Sep 30, 2011
Sold by
Cornwell Matthew S and Cornwell Amanda
Bought by
Mendez Alvino R
Current Estimated Value
Home Financials for this Owner
Home Financials are based on the most recent Mortgage that was taken out on this home.
Original Mortgage
$47,560
Outstanding Balance
$32,625
Interest Rate
4.22%
Mortgage Type
New Conventional
Estimated Equity
$41,910
Purchase Details
Closed on
Nov 18, 2005
Sold by
Fransen Dylan G and Fransen Heather L
Bought by
Cornwell Matthew S
Home Financials for this Owner
Home Financials are based on the most recent Mortgage that was taken out on this home.
Original Mortgage
$47,900
Interest Rate
6.04%
Mortgage Type
New Conventional
Create a Home Valuation Report for This Property
The Home Valuation Report is an in-depth analysis detailing your home's value as well as a comparison with similar homes in the area
Home Values in the Area
Average Home Value in this Area
Purchase History
| Date | Buyer | Sale Price | Title Company |
|---|---|---|---|
| Mendez Alvino R | $46,000 | None Available | |
| Cornwell Matthew S | $48,000 | None Available |
Source: Public Records
Mortgage History
| Date | Status | Borrower | Loan Amount |
|---|---|---|---|
| Open | Mendez Alvino R | $47,560 | |
| Previous Owner | Cornwell Matthew S | $47,900 |
Source: Public Records
Tax History
| Year | Tax Paid | Tax Assessment Tax Assessment Total Assessment is a certain percentage of the fair market value that is determined by local assessors to be the total taxable value of land and additions on the property. | Land | Improvement |
|---|---|---|---|---|
| 2024 | $1,312 | $18,586 | $3,302 | $15,284 |
| 2023 | $1,200 | $17,447 | $3,100 | $14,347 |
| 2022 | $1,143 | $16,693 | $2,966 | $13,727 |
| 2021 | $1,065 | $15,742 | $2,797 | $12,945 |
| 2020 | $1,012 | $15,191 | $2,699 | $12,492 |
| 2019 | $994 | $14,915 | $2,650 | $12,265 |
| 2018 | $984 | $14,939 | $2,654 | $12,285 |
| 2017 | $982 | $14,837 | $2,636 | $12,201 |
| 2016 | $935 | $14,359 | $2,551 | $11,808 |
| 2015 | $91 | $14,753 | $2,621 | $12,132 |
| 2014 | $895 | $14,426 | $2,563 | $11,863 |
| 2013 | $91 | $14,753 | $2,621 | $12,132 |
Source: Public Records
Map
Nearby Homes
- 203 17th Ave
- 612 15th Ave
- 510 12th Ave
- 0 E 4th St
- 1307 Sinnissippi Park Rd
- Lot 4 E 19th St
- Lot 1 E 19th St
- 1825 18th Ave
- 813 E 15th St
- 1908 22nd Ave
- 802 E 5th St
- 2912 Woodlawn Rd
- 601 8th Ave
- 802 E 19th St
- 2212 12th Ave
- 1316 Mineral Springs Rd
- 226 Avenue F
- 905 E 21st St
- 2408 16th Ave
- Lot 403 E 21st St
Your Personal Tour Guide
Ask me questions while you tour the home.