
Seller's Agent in 2019
Tracy Shaw
Keller Williams Capital
(217) 494-1334
323 Total Sales


Estimated Value: $127,000 - $154,000
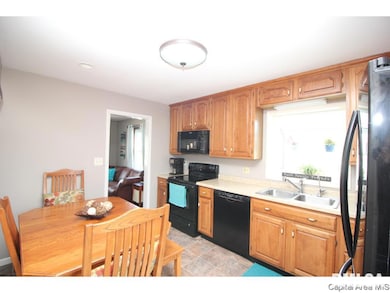
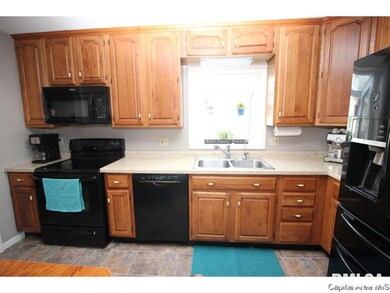
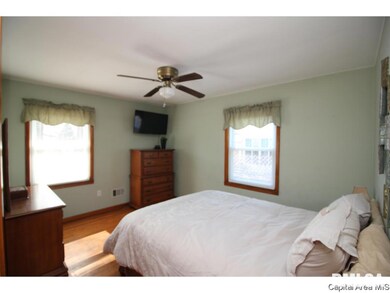
Nice ranch home with great space! Hardwood floors throughout is perfect for allergy sufferers. Abundance of natural light. Eat in kitchen has new counter-tops and new vinyl flooring. Main bath was updated in 2018. Full basement has finished family area, full bath and bonus area. Basement also has 2 additional unfinished storage areas, one which is shared with laundry area. Fenced backyard and detached 1.5 car garage.
Last Agent to Sell the Property
Keller Williams Capital License #475134690 Listed on: 02/27/2019
Last Buyer's Agent
Kathy Park
IN BETWEEN OFFICES License #475128443
| Date | Buyer | Sale Price | Title Company |
|---|---|---|---|
| Wrincik Michael S | $88,000 | -- | |
| -- | $75,000 | -- |
| Date | Status | Borrower | Loan Amount |
|---|---|---|---|
| Open | Wrincik Michael S | $66,000 |
| Date | Event | Price | List to Sale | Price per Sq Ft |
|---|---|---|---|---|
| 04/30/2019 04/30/19 | Sold | $88,000 | -6.4% | $61 / Sq Ft |
| 03/14/2019 03/14/19 | Pending | -- | -- | -- |
| 02/27/2019 02/27/19 | For Sale | $94,000 | -- | $65 / Sq Ft |
| Year | Tax Paid | Tax Assessment Tax Assessment Total Assessment is a certain percentage of the fair market value that is determined by local assessors to be the total taxable value of land and additions on the property. | Land | Improvement |
|---|---|---|---|---|
| 2024 | $2,791 | $34,513 | $7,158 | $27,355 |
| 2023 | $2,746 | $31,957 | $6,628 | $25,329 |
| 2022 | $2,636 | $30,242 | $6,272 | $23,970 |
| 2021 | $2,545 | $29,056 | $6,026 | $23,030 |
| 2020 | $2,327 | $28,739 | $5,960 | $22,779 |
| 2019 | $1,767 | $28,237 | $5,856 | $22,381 |
| 2018 | $1,705 | $28,116 | $5,831 | $22,285 |
| 2017 | $1,657 | $27,684 | $5,741 | $21,943 |
| 2016 | $1,595 | $26,970 | $5,593 | $21,377 |
| 2015 | $1,555 | $26,361 | $5,467 | $20,894 |
| 2014 | $1,525 | $26,141 | $5,421 | $20,720 |
| 2013 | $1,507 | $26,421 | $5,479 | $20,942 |
Seller's Agent in 2019
Tracy Shaw
Keller Williams Capital
(217) 494-1334
323 Total Sales
K
Buyer's Agent in 2019
Kathy Park
IN BETWEEN OFFICES
Source: RMLS Alliance
MLS Number: RMACA191110
APN: 22-14.0-107-002
Disclaimer: Certain information contained herein is derived from information provided by parties other than Homes.com. All information provided is deemed reliable, but is not guaranteed to be accurate and should be independently verified.
![]() Based on information submitted to the MLS GRID. All data is obtained from various sources and may not have been verified by broker or MLS GRID. Supplied Open House Information is subject to change without notice. All information should be independently reviewed and verified for accuracy. Properties may or may not be listed by the office/agent presenting the information. Some IDX listings have been excluded from this website.IDX information is provided exclusively for personal, non-commercial use, and may not be used for any purpose other than to identify prospective properties consumers may be interested in purchasing. Information is deemed reliable but not guaranteed.
Based on information submitted to the MLS GRID. All data is obtained from various sources and may not have been verified by broker or MLS GRID. Supplied Open House Information is subject to change without notice. All information should be independently reviewed and verified for accuracy. Properties may or may not be listed by the office/agent presenting the information. Some IDX listings have been excluded from this website.IDX information is provided exclusively for personal, non-commercial use, and may not be used for any purpose other than to identify prospective properties consumers may be interested in purchasing. Information is deemed reliable but not guaranteed.
Based on information submitted to the MLS GRID
Ask me questions while you tour the home.