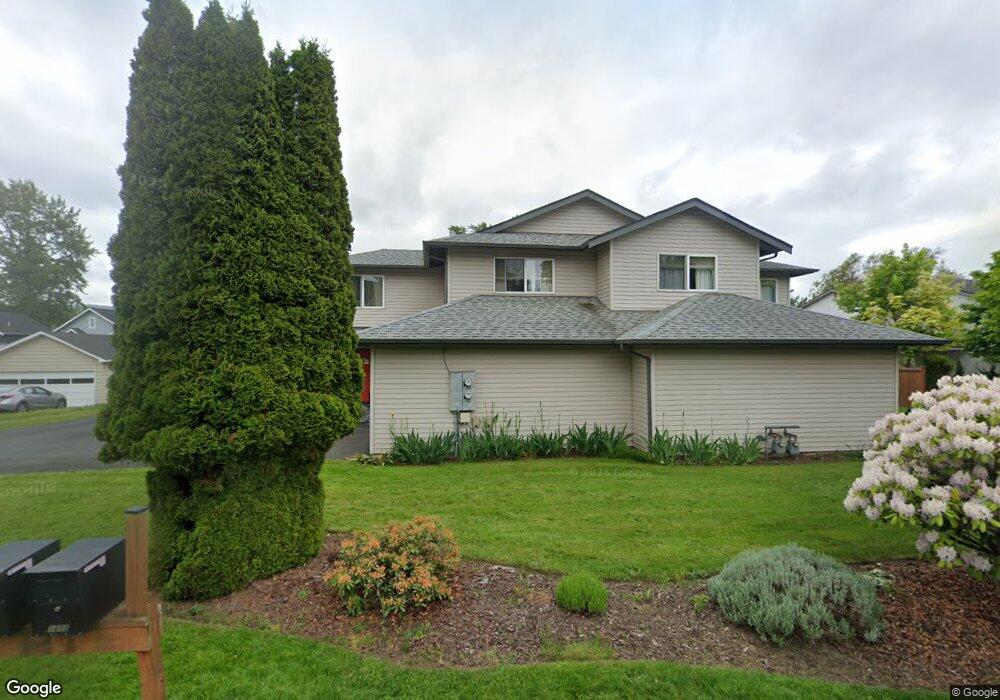
1804 E Maryland St Unit 1804 Bellingham, WA 98226
Roosevelt NeighborhoodEstimated Value: $447,421 - $521,000
3
Beds
3
Baths
1,332
Sq Ft
$364/Sq Ft
Est. Value
About This Home
This home is located at 1804 E Maryland St Unit 1804, Bellingham, WA 98226 and is currently estimated at $484,355, approximately $363 per square foot. 1804 E Maryland St Unit 1804 is a home located in Whatcom County with nearby schools including Northern Heights Elementary School, Shuksan Middle School, and Squalicum High School.
Ownership History
Date
Name
Owned For
Owner Type
Purchase Details
Closed on
Mar 16, 2005
Sold by
Northwest Property Investments Llc
Bought by
Morris Jason A and Morris Karen M
Current Estimated Value
Home Financials for this Owner
Home Financials are based on the most recent Mortgage that was taken out on this home.
Original Mortgage
$167,800
Outstanding Balance
$78,751
Interest Rate
4.5%
Mortgage Type
Purchase Money Mortgage
Estimated Equity
$405,604
Purchase Details
Closed on
Feb 20, 2001
Sold by
Roy Milton & Sharon Ruth Schayes Family and Wayne Marvin
Bought by
Northwest Property Investments Llc
Create a Home Valuation Report for This Property
The Home Valuation Report is an in-depth analysis detailing your home's value as well as a comparison with similar homes in the area
Home Values in the Area
Average Home Value in this Area
Purchase History
| Date | Buyer | Sale Price | Title Company |
|---|---|---|---|
| Morris Jason A | $209,900 | Chicago Title Insurance | |
| Northwest Property Investments Llc | -- | Chicago Title Insurance | |
| Roy Milton & Sharon Ruth Schayes Family | -- | Chicago Title Insurance |
Source: Public Records
Mortgage History
| Date | Status | Borrower | Loan Amount |
|---|---|---|---|
| Open | Morris Jason A | $167,800 | |
| Closed | Morris Jason A | $20,950 |
Source: Public Records
Tax History Compared to Growth
Tax History
| Year | Tax Paid | Tax Assessment Tax Assessment Total Assessment is a certain percentage of the fair market value that is determined by local assessors to be the total taxable value of land and additions on the property. | Land | Improvement |
|---|---|---|---|---|
| 2024 | $3,483 | $447,290 | $87,232 | $360,058 |
| 2023 | $3,483 | $447,290 | $87,232 | $360,058 |
| 2022 | $3,039 | $369,668 | $72,094 | $297,574 |
| 2021 | $2,927 | $327,140 | $63,800 | $263,340 |
| 2020 | $2,839 | $297,400 | $58,000 | $239,400 |
| 2019 | $2,334 | $278,810 | $55,762 | $223,048 |
| 2018 | $2,467 | $229,810 | $45,962 | $183,848 |
| 2017 | $2,181 | $207,673 | $41,535 | $166,138 |
| 2016 | $1,981 | $191,923 | $38,385 | $153,538 |
| 2015 | $1,975 | $181,423 | $36,285 | $145,138 |
| 2014 | -- | $175,000 | $35,000 | $140,000 |
| 2013 | -- | $166,940 | $34,370 | $132,570 |
Source: Public Records
Map
Nearby Homes
- 1812 E Maryland St
- 2873 Undine St
- 1813 Undine Ln
- 1737 Sunup Loop
- 1735 Sunup Loop
- 1733 Sunup Loop
- 2809 Valencia St
- 2619 Woburn St
- 2615 Woburn St
- 2617 Woburn St
- 1714 Sunup Loop
- 1716 Sunup Loop
- 1712 Sunup Loop
- 3020 E North St
- 3024 E North St
- 2639 Yew St
- 2330 Verona St
- 2929 Nevada St
- 2316 Xenia St
- 2341 Michigan St
- 1806 E Maryland St Unit 1806
- 1802 E Maryland St Unit 1802
- 1810 E Maryland St Unit 1810
- 1808 E Maryland St
- 1800 E Maryland St Unit 1800
- 1750 E Maryland St
- 1740 E Maryland St
- 1817 E Maryland St
- 1817 E Maryland St
- 1801 E Maryland St
- 1819 E Maryland St
- 18171819 E Maryland
- 1722 E Maryland St
- 1728 E Maryland St
- 1818 E Maryland St
- 1821 E Maryland St
- 2801 Undine St
- 1725 E Maryland St
- 1811 E Maryland St