1804 Fairview Ct Lynden, WA 98264
Estimated Value: $815,000 - $955,000
5
Beds
3
Baths
2,749
Sq Ft
$317/Sq Ft
Est. Value
About This Home
This home is located at 1804 Fairview Ct, Lynden, WA 98264 and is currently estimated at $872,320, approximately $317 per square foot. 1804 Fairview Ct is a home located in Whatcom County with nearby schools including Lynden High School, Lynden Christian School, and Lynden Christian Schools: Administration.
Ownership History
Date
Name
Owned For
Owner Type
Purchase Details
Closed on
Mar 2, 2016
Sold by
Timmermans Irvin and Timmermans Jane
Bought by
Timmermans Tyler J and Timmermans Roxanne G
Current Estimated Value
Home Financials for this Owner
Home Financials are based on the most recent Mortgage that was taken out on this home.
Original Mortgage
$175,000
Outstanding Balance
$139,153
Interest Rate
3.79%
Mortgage Type
New Conventional
Estimated Equity
$733,167
Create a Home Valuation Report for This Property
The Home Valuation Report is an in-depth analysis detailing your home's value as well as a comparison with similar homes in the area
Home Values in the Area
Average Home Value in this Area
Purchase History
| Date | Buyer | Sale Price | Title Company |
|---|---|---|---|
| Timmermans Tyler J | $375,000 | Chicago Title Insurance |
Source: Public Records
Mortgage History
| Date | Status | Borrower | Loan Amount |
|---|---|---|---|
| Open | Timmermans Tyler J | $175,000 |
Source: Public Records
Tax History Compared to Growth
Tax History
| Year | Tax Paid | Tax Assessment Tax Assessment Total Assessment is a certain percentage of the fair market value that is determined by local assessors to be the total taxable value of land and additions on the property. | Land | Improvement |
|---|---|---|---|---|
| 2024 | $5,982 | $848,277 | $242,500 | $605,777 |
| 2023 | $5,982 | $832,478 | $250,000 | $582,478 |
| 2022 | $5,929 | $778,116 | $153,434 | $624,682 |
| 2021 | $5,815 | $643,063 | $126,803 | $516,260 |
| 2020 | $5,094 | $574,179 | $113,220 | $460,959 |
| 2019 | $4,533 | $526,500 | $103,955 | $422,545 |
| 2018 | $4,954 | $480,250 | $94,699 | $385,551 |
| 2017 | $4,643 | $431,065 | $85,000 | $346,065 |
| 2016 | $4,366 | $429,711 | $85,250 | $344,461 |
| 2015 | $3,870 | $401,885 | $81,995 | $319,890 |
| 2014 | -- | $388,277 | $79,205 | $309,072 |
| 2013 | -- | $386,572 | $77,500 | $309,072 |
Source: Public Records
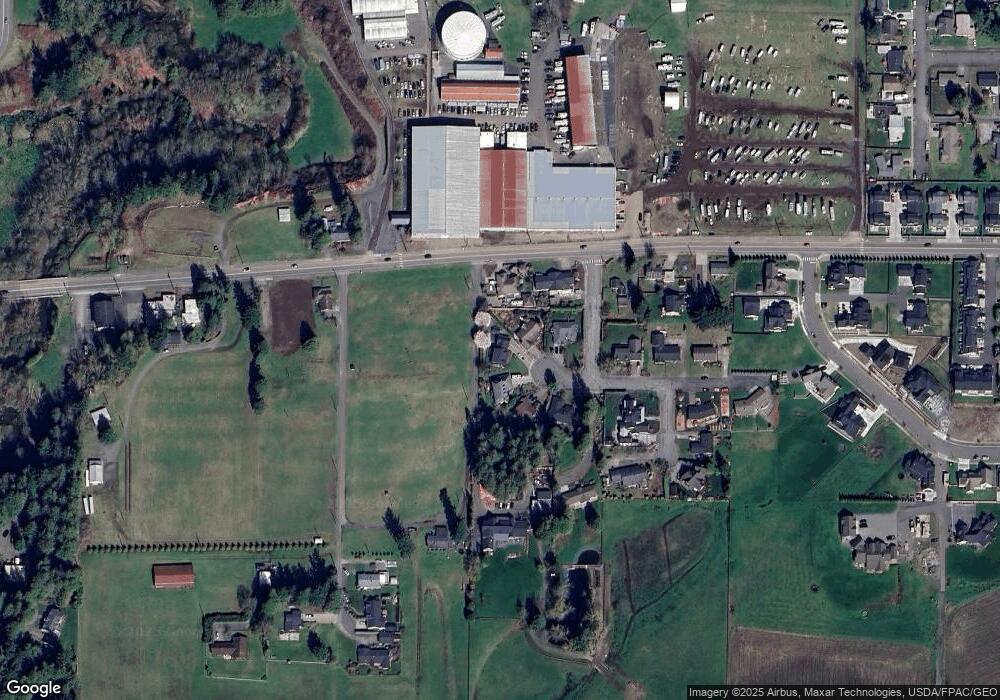
Map
Nearby Homes
- 1774 Farmview Terrace
- 416 Stremler Dr
- 1710 Farmview Terrace
- 1717 E St
- 1882 Front St Unit B111
- 106 Fairside Dr Unit D
- 2016 Steelhead Way
- 151 Bay Lyn Dr
- 801 19th St
- 2010 Front St Unit 33
- 403 17th St
- 102 Duffner Dr
- 605 N Forest Ct
- 1218 Front St
- 2 Guide Meridian Rd
- 1843 Main St Unit B2
- 515 17th St
- 8374 W Meadow Ln
- 0 Guide Meridian Unit NWM2369980
- 812 S Pine Ct