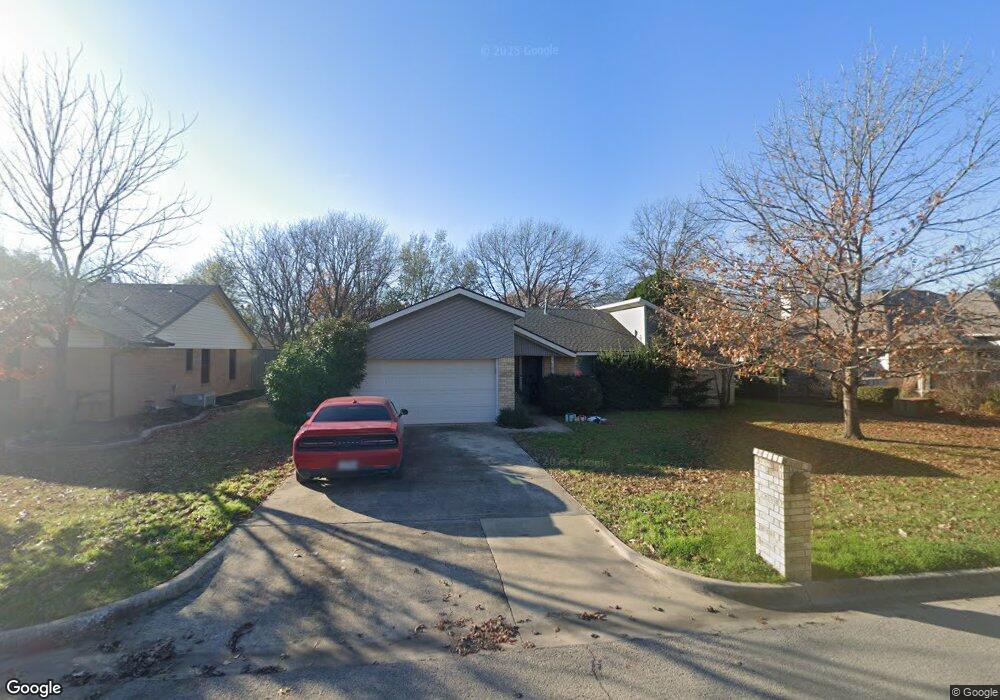
1804 Highland Park Rd Denton, TX 76205
Denia NeighborhoodEstimated Value: $297,728 - $332,000
3
Beds
2
Baths
1,535
Sq Ft
$207/Sq Ft
Est. Value
About This Home
This home is located at 1804 Highland Park Rd, Denton, TX 76205 and is currently estimated at $317,182, approximately $206 per square foot. 1804 Highland Park Rd is a home located in Denton County with nearby schools including Borman Elementary School, McMath Middle School, and Denton High School.
Ownership History
Date
Name
Owned For
Owner Type
Purchase Details
Closed on
Nov 4, 2002
Sold by
Ward Andrew D and Ward Kimberly D
Bought by
Ward Andrew D and Ward Kimberly R
Current Estimated Value
Home Financials for this Owner
Home Financials are based on the most recent Mortgage that was taken out on this home.
Original Mortgage
$93,190
Interest Rate
6.13%
Mortgage Type
FHA
Purchase Details
Closed on
Oct 29, 1999
Sold by
Carmouche Anthony and Carmouche Tawana
Bought by
Ward Andrew D and Ward Kimberly D
Home Financials for this Owner
Home Financials are based on the most recent Mortgage that was taken out on this home.
Original Mortgage
$94,951
Interest Rate
7.77%
Mortgage Type
FHA
Purchase Details
Closed on
Mar 11, 1996
Sold by
Burkhardt David R and Burkhardt Linda Ann
Bought by
Carmouche Anthony and Carmouche Tawana
Create a Home Valuation Report for This Property
The Home Valuation Report is an in-depth analysis detailing your home's value as well as a comparison with similar homes in the area
Home Values in the Area
Average Home Value in this Area
Purchase History
| Date | Buyer | Sale Price | Title Company |
|---|---|---|---|
| Ward Andrew D | -- | -- | |
| Ward Andrew D | -- | First American Title Co | |
| Carmouche Anthony | -- | -- |
Source: Public Records
Mortgage History
| Date | Status | Borrower | Loan Amount |
|---|---|---|---|
| Closed | Ward Andrew D | $93,190 | |
| Closed | Ward Andrew D | $94,951 |
Source: Public Records
Tax History Compared to Growth
Tax History
| Year | Tax Paid | Tax Assessment Tax Assessment Total Assessment is a certain percentage of the fair market value that is determined by local assessors to be the total taxable value of land and additions on the property. | Land | Improvement |
|---|---|---|---|---|
| 2025 | $3,597 | $239,228 | $78,375 | $160,853 |
| 2024 | $4,793 | $248,311 | $78,375 | $169,936 |
| 2023 | $3,135 | $226,848 | $78,375 | $167,710 |
| 2022 | $4,378 | $206,225 | $78,375 | $127,850 |
| 2021 | $4,200 | $188,937 | $51,188 | $137,749 |
| 2020 | $3,967 | $173,573 | $51,188 | $123,376 |
| 2019 | $3,765 | $157,794 | $51,188 | $123,814 |
| 2018 | $3,465 | $143,449 | $51,188 | $111,321 |
| 2017 | $3,223 | $130,408 | $33,731 | $96,677 |
| 2016 | $2,988 | $120,896 | $33,731 | $87,165 |
| 2015 | $2,449 | $112,791 | $33,731 | $79,060 |
| 2013 | -- | $113,583 | $33,731 | $79,852 |
Source: Public Records
Map
Nearby Homes
- PARROT Plan at Eagle Creek
- LARK Plan at Eagle Creek
- ROBIN Plan at Eagle Creek
- Texas Mockingbird Plan at Eagle Creek
- Kingbird Plan at Eagle Creek
- Plan 2824 at Eagle Creek
- MALLARD Plan at Eagle Creek
- Plan 2444 Modeled at Eagle Creek
- Plan 2501 at Eagle Creek
- SWAN Plan at Eagle Creek
- QUAIL Plan at Eagle Creek
- Plan 1581 at Eagle Creek
- OWL Plan at Eagle Creek
- Plan 1754 at Eagle Creek
- Plan 1676 Modeled at Eagle Creek
- Plan 2004 at Eagle Creek
- Plan 1849 at Eagle Creek
- BLUE JAY Plan at Eagle Creek
- 1618 Kendolph Dr
- 2030 Golf Ct
- 1806 Highland Park Rd
- 1802 Highland Park Rd
- 1805 Wisteria St
- 1808 Highland Park Rd
- 1803 Wisteria St
- 1924 Willowcrest Loop
- 1807 Wisteria St
- 1800 Highland Park Rd
- 2003 Willowwood St
- 1925 Willowcrest Loop
- 1810 Highland Park Rd
- 1809 Wisteria St
- 2005 Willowwood St
- 1925 Willowwood St
- 1922 Willowcrest Loop
- 1923 Willowcrest Loop
- 1811 Wisteria St
- 1932 Willowcrest Loop
- 1812 Highland Park Rd
- 1923 Willowwood St