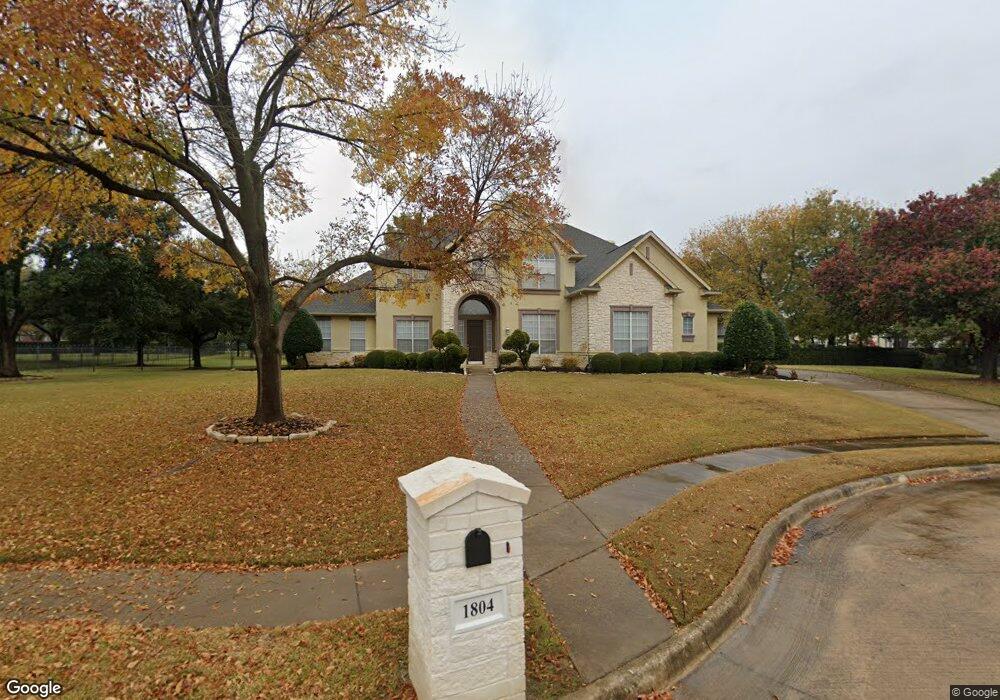
1804 Native Dancer Place Southlake, TX 76092
Estimated Value: $1,530,415 - $1,671,000
4
Beds
4
Baths
4,427
Sq Ft
$358/Sq Ft
Est. Value
About This Home
This home is located at 1804 Native Dancer Place, Southlake, TX 76092 and is currently estimated at $1,583,104, approximately $357 per square foot. 1804 Native Dancer Place is a home located in Tarrant County with nearby schools including Carroll Elementary School, Eubanks Intermediate School, and George Dawson Middle School.
Ownership History
Date
Name
Owned For
Owner Type
Purchase Details
Closed on
Sep 30, 2025
Sold by
Li Alan
Bought by
Li Family Trust and Li
Current Estimated Value
Purchase Details
Closed on
Aug 16, 2001
Sold by
Ermish Peter R
Bought by
Li Alan and Li Yueh Hua
Home Financials for this Owner
Home Financials are based on the most recent Mortgage that was taken out on this home.
Original Mortgage
$250,000
Interest Rate
7.14%
Purchase Details
Closed on
Jun 30, 1999
Sold by
Southlake Woods Lp
Bought by
Ermish Peter R
Home Financials for this Owner
Home Financials are based on the most recent Mortgage that was taken out on this home.
Original Mortgage
$413,200
Interest Rate
7.47%
Create a Home Valuation Report for This Property
The Home Valuation Report is an in-depth analysis detailing your home's value as well as a comparison with similar homes in the area
Home Values in the Area
Average Home Value in this Area
Purchase History
| Date | Buyer | Sale Price | Title Company |
|---|---|---|---|
| Li Family Trust | -- | None Listed On Document | |
| Li Alan | -- | -- | |
| Ermish Peter R | -- | Stewart Title |
Source: Public Records
Mortgage History
| Date | Status | Borrower | Loan Amount |
|---|---|---|---|
| Previous Owner | Li Alan | $250,000 | |
| Previous Owner | Ermish Peter R | $413,200 |
Source: Public Records
Tax History Compared to Growth
Tax History
| Year | Tax Paid | Tax Assessment Tax Assessment Total Assessment is a certain percentage of the fair market value that is determined by local assessors to be the total taxable value of land and additions on the property. | Land | Improvement |
|---|---|---|---|---|
| 2025 | $8,359 | $1,492,734 | $525,000 | $967,734 |
| 2024 | $8,359 | $1,492,734 | $525,000 | $967,734 |
| 2023 | $8,560 | $1,519,476 | $525,000 | $994,476 |
| 2022 | $21,026 | $1,135,965 | $375,000 | $760,965 |
| 2021 | $20,201 | $967,614 | $375,000 | $592,614 |
| 2020 | $18,515 | $861,008 | $450,000 | $411,008 |
| 2019 | $17,731 | $732,245 | $270,000 | $462,245 |
| 2018 | $12,321 | $781,251 | $270,000 | $511,251 |
| 2017 | $18,661 | $773,561 | $270,000 | $503,561 |
| 2016 | $16,964 | $762,491 | $270,000 | $492,491 |
| 2015 | $12,059 | $622,200 | $90,000 | $532,200 |
| 2014 | $12,059 | $622,200 | $90,000 | $532,200 |
Source: Public Records
Map
Nearby Homes
- 710 Deer Hollow Blvd
- 690 S Peytonville Ave
- 503 Indian Paintbrush Way
- 929 Winding Ridge Trail
- 945 Deer Hollow Blvd
- 1010 Deer Hollow Blvd
- 1002 Chimney Hill Trail
- 2530 & 2580 W Southlake Blvd
- 2401 Lower Brook Ct
- 205 Lovegrass Ln
- 2525 Park Grove Loop
- 1904 Cresson Dr
- 1005 Siena Dr
- 1712 Wild Rose Way
- 1205 Scenic Dr
- 2616 Park Grove Loop
- 2608 W Southlake Blvd
- 2620 Park Grove Loop
- 112 Stony Brook Way
- 2636 Park Grove Loop
- 1808 Native Dancer Place
- 610 Indian Paintbrush Way
- 1800 Native Dancer Place
- 1717 Kingsley Ct
- 1721 Kingsley Ct
- 1805 Native Dancer Place
- 1801 Native Dancer Place
- 1901 Country Moss Way
- 1809 Native Dancer Place
- 1900 Country Moss Way
- 1900 White Oak Clearing
- 1716 Kingsley Ct
- 608 Indian Paintbrush Way
- 730 Deer Hollow Blvd
- 1901 Big Bend Cove
- 1713 Kingsley Ct
- 720 Deer Hollow Blvd
- 1904 Country Moss Way
- 740 Deer Hollow Blvd
- 1905 Country Moss Way