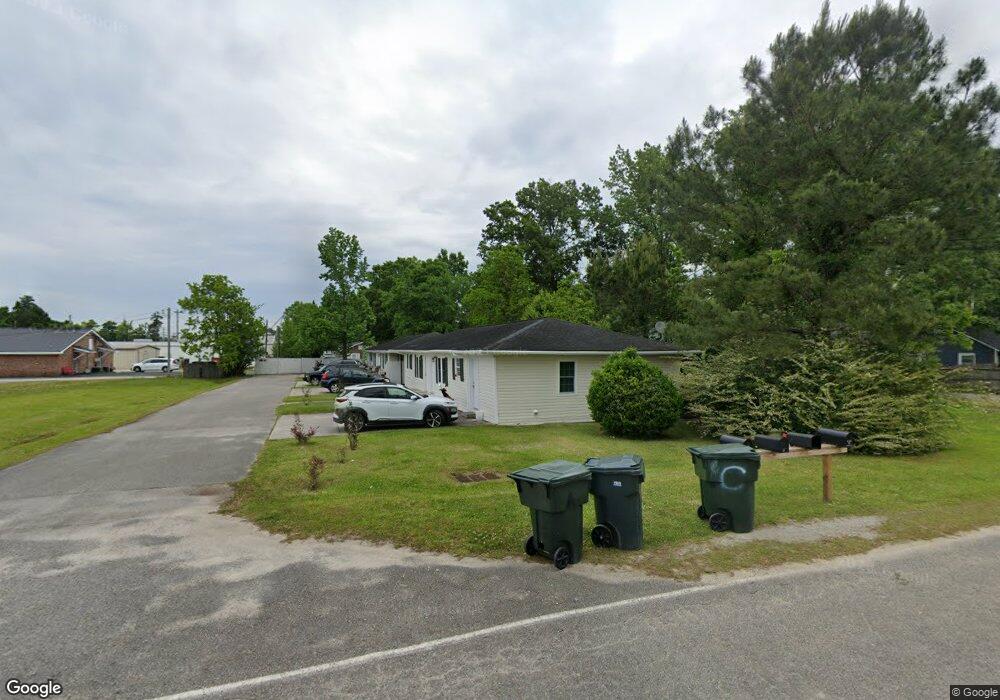
1804 Sessions St Conway, SC 29526
Estimated Value: $265,000 - $376,000
4
Beds
2
Baths
1,350
Sq Ft
$237/Sq Ft
Est. Value
About This Home
This home is located at 1804 Sessions St, Conway, SC 29526 and is currently estimated at $319,313, approximately $236 per square foot. 1804 Sessions St is a home located in Horry County with nearby schools including Conway Elementary School, Conway Middle School, and Conway High School.
Ownership History
Date
Name
Owned For
Owner Type
Purchase Details
Closed on
Dec 28, 2021
Sold by
Shortwave Holdings Llc
Bought by
Shorline Contractors Llc
Current Estimated Value
Purchase Details
Closed on
Apr 27, 2007
Sold by
Kobos Edward J
Bought by
Shortwave Holdings Llc
Purchase Details
Closed on
Sep 19, 2002
Sold by
Mclain James M and Mclain Alanda C
Bought by
Todd Robert Eugene and Todd Lynn H
Purchase Details
Closed on
Apr 29, 2002
Sold by
Mcsorley John Paul
Bought by
Mclain James M and Mclain Alanda C
Purchase Details
Closed on
Jan 12, 1999
Sold by
Sanders Lella Faye B
Bought by
Mcsorley John Paul
Home Financials for this Owner
Home Financials are based on the most recent Mortgage that was taken out on this home.
Original Mortgage
$59,123
Interest Rate
6.72%
Mortgage Type
Purchase Money Mortgage
Create a Home Valuation Report for This Property
The Home Valuation Report is an in-depth analysis detailing your home's value as well as a comparison with similar homes in the area
Home Values in the Area
Average Home Value in this Area
Purchase History
| Date | Buyer | Sale Price | Title Company |
|---|---|---|---|
| Shorline Contractors Llc | $310,000 | -- | |
| Shortwave Holdings Llc | -- | None Available | |
| Todd Robert Eugene | $80,000 | -- | |
| Mclain James M | $65,000 | -- | |
| Mcsorley John Paul | -- | -- |
Source: Public Records
Mortgage History
| Date | Status | Borrower | Loan Amount |
|---|---|---|---|
| Previous Owner | Mcsorley John Paul | $59,123 |
Source: Public Records
Tax History
| Year | Tax Paid | Tax Assessment Tax Assessment Total Assessment is a certain percentage of the fair market value that is determined by local assessors to be the total taxable value of land and additions on the property. | Land | Improvement |
|---|---|---|---|---|
| 2025 | $4,322 | $0 | $0 | $0 |
| 2024 | $4,322 | $19,441 | $4,308 | $15,133 |
| 2023 | $4,277 | $11,302 | $1,532 | $9,770 |
| 2021 | $4,910 | $11,768 | $1,532 | $10,236 |
| 2020 | $2,879 | $11,768 | $1,532 | $10,236 |
| 2019 | $2,879 | $11,768 | $1,532 | $10,236 |
| 2018 | $2,633 | $9,828 | $1,518 | $8,310 |
| 2017 | $2,633 | $9,828 | $1,518 | $8,310 |
| 2016 | -- | $9,828 | $1,518 | $8,310 |
| 2015 | $2,633 | $9,828 | $1,518 | $8,310 |
| 2014 | $2,563 | $9,828 | $1,518 | $8,310 |
Source: Public Records
Map
Nearby Homes
- 1704 Sherwood Dr
- 1605 Sessions St
- 1547 Stilley Cir
- 1541 Stilley Cir
- 116 Kingsbury Loop Unit C
- 1229 Park Hill Dr
- 708 15th Ave
- 302 Jackson Ln
- 218 Busbee St
- 2424 Main St
- 208 Sherwood Dr
- 1170 Oak Meadows Dr
- 1170 Oak Meadows Dr Unit Lot 141
- 206 Magrath Ave
- 2616 Hudson Trail
- 1003 Winding Rd
- 0 Mill Pond Rd Unit 2507308
- 1006 10th Ave
- 1305 Forest View Rd
- 2821 Rivolet Dr
- 1804 Sessions St Unit s A, B, C & D
- 1802 Sessions St
- 2000 Main St
- 1800 Sessions St
- 604 18th Ave
- 1803 Sessions St Unit Lot 8, Pecan Alt 2
- 2008 Main St
- 602 18th Ave
- 1805 Mcdermott St
- 2000 U S 701 Hwy
- 2008 N Main St
- Lot 8 Sessions St
- Lot 6 Sessions St
- 1801 Sessions St
- 1803 Mcdermott St
- 1803 Mcdermott St
- 2010 Main St
- 2010 N Main St
- 600 18th Ave
- 607 18th Ave
Your Personal Tour Guide
Ask me questions while you tour the home.