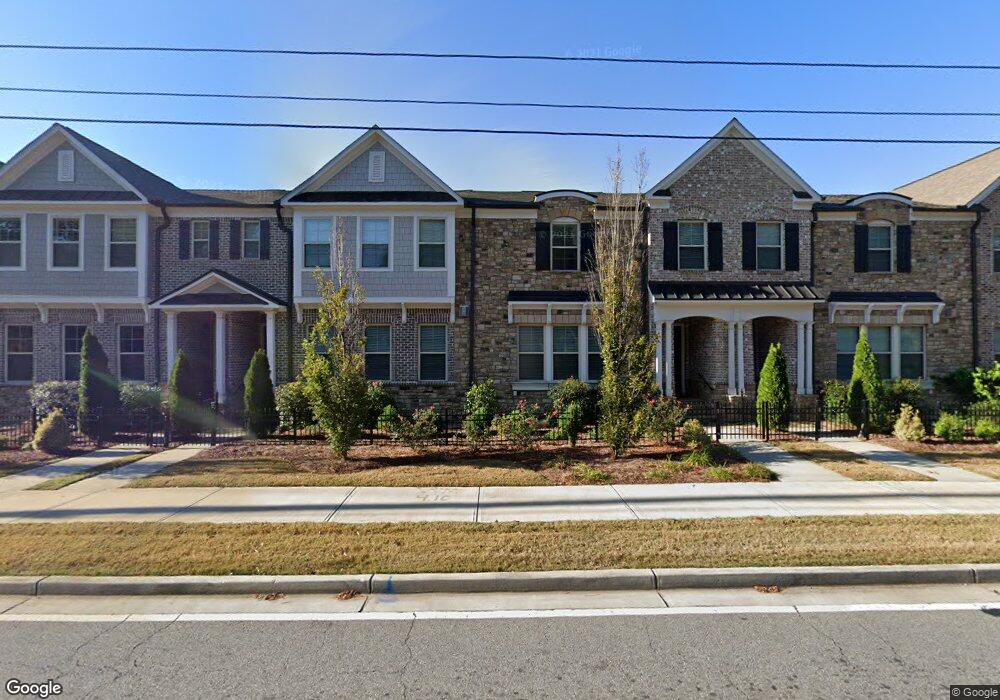
1804 Stephanie Trail NE Unit 53 Atlanta, GA 30329
Merry Hills NeighborhoodEstimated Value: $630,000 - $696,000
3
Beds
4
Baths
2,365
Sq Ft
$277/Sq Ft
Est. Value
About This Home
This home is located at 1804 Stephanie Trail NE Unit 53, Atlanta, GA 30329 and is currently estimated at $655,645, approximately $277 per square foot. 1804 Stephanie Trail NE Unit 53 is a home located in DeKalb County with nearby schools including Briar Vista Elementary School, Druid Hills Middle School, and Druid Hills High School.
Ownership History
Date
Name
Owned For
Owner Type
Purchase Details
Closed on
Jul 8, 2022
Sold by
Chitalwala Amin
Bought by
Cholli Preetam and Lang Nichole
Current Estimated Value
Home Financials for this Owner
Home Financials are based on the most recent Mortgage that was taken out on this home.
Original Mortgage
$598,500
Outstanding Balance
$570,089
Interest Rate
5.23%
Mortgage Type
New Conventional
Estimated Equity
$85,556
Purchase Details
Closed on
Feb 22, 2021
Sold by
Liendgens Katja
Bought by
Chitalwala Amin and Chitalwala Aziz
Purchase Details
Closed on
Jul 19, 2017
Sold by
Calatlantic Group Inc
Bought by
Liendgens Katja and Magnusson Asa
Home Financials for this Owner
Home Financials are based on the most recent Mortgage that was taken out on this home.
Original Mortgage
$215,000
Interest Rate
4.03%
Create a Home Valuation Report for This Property
The Home Valuation Report is an in-depth analysis detailing your home's value as well as a comparison with similar homes in the area
Home Values in the Area
Average Home Value in this Area
Purchase History
| Date | Buyer | Sale Price | Title Company |
|---|---|---|---|
| Cholli Preetam | $626,000 | -- | |
| Chitalwala Amin | $522,500 | -- | |
| Liendgens Katja | $517,000 | -- |
Source: Public Records
Mortgage History
| Date | Status | Borrower | Loan Amount |
|---|---|---|---|
| Open | Cholli Preetam | $598,500 | |
| Previous Owner | Liendgens Katja | $215,000 |
Source: Public Records
Tax History Compared to Growth
Tax History
| Year | Tax Paid | Tax Assessment Tax Assessment Total Assessment is a certain percentage of the fair market value that is determined by local assessors to be the total taxable value of land and additions on the property. | Land | Improvement |
|---|---|---|---|---|
| 2024 | $7,798 | $245,360 | $60,000 | $185,360 |
| 2023 | $7,798 | $225,920 | $60,000 | $165,920 |
| 2022 | $9,438 | $209,000 | $43,800 | $165,200 |
| 2021 | $6,817 | $201,840 | $44,000 | $157,840 |
| 2020 | $6,887 | $203,680 | $44,000 | $159,680 |
| 2019 | $6,929 | $207,360 | $44,000 | $163,360 |
| 2018 | $7,335 | $199,040 | $44,000 | $155,040 |
| 2017 | $9,502 | $207,560 | $44,000 | $163,560 |
| 2016 | $1,948 | $38,080 | $38,080 | $0 |
Source: Public Records
Map
Nearby Homes
- 1435 Druid Manor Blvd NE
- 1438 Druid Manor Blvd NE
- 1851 Fern Creek Ln NE
- 1463 Edgebrook Ct NE Unit 14
- 1949 Townsend Ct NE Unit 22
- 1461 Wembley Ct NE
- 1482 N Crossing Cir NE
- 1443 Fama Dr NE
- 1404 N Crossing Dr NE
- 1514 Woodbridge Way NE
- 1636 Beacon Hill Blvd NE
- 1600 Belle Isle Cir NE
- 1660 Bristol Dr NE
- 2034 Pine Forest Dr NE
- 1185 Houston Mill Rd NE
- 2132 Clairmont Rd
- 1680 Bristol Dr NE
- 2233 Clairmont Rd NE
- 2077 Trailmark Dr
- 1804 Stephanie Trail NE
- 1802 Stephanie Trail NE Unit 54
- 1806 Stephanie Trail Unit 52
- 1808 Stephanie Trail NE
- 1808 Stephanie Trail NE Unit 51
- 1808 Stephanie Trail NE Unit 1
- 1798 Stephanie Trail NE
- 1798 Stephanie Trail NE Unit 56
- 2713 N Druid Hills Rd NE
- 1800 Stephanie Trail NE Unit 55
- 1810 Stephanie Trail Unit 50
- 2721 N Druid Hills Rd NE
- 1794 Stephanie Trail NE Unit 57
- 2705 N Druid Hills Rd NE
- 1814 Stephanie Trail NE
- 1814 Stephanie Trail NE Unit 49
- 1792 Stephanie Trail NE
- 1792 Stephanie Trail NE Unit 58
- 1792 Stephanie Trail NE Unit TR
- 1816 Stephanie Trail NE Unit 44