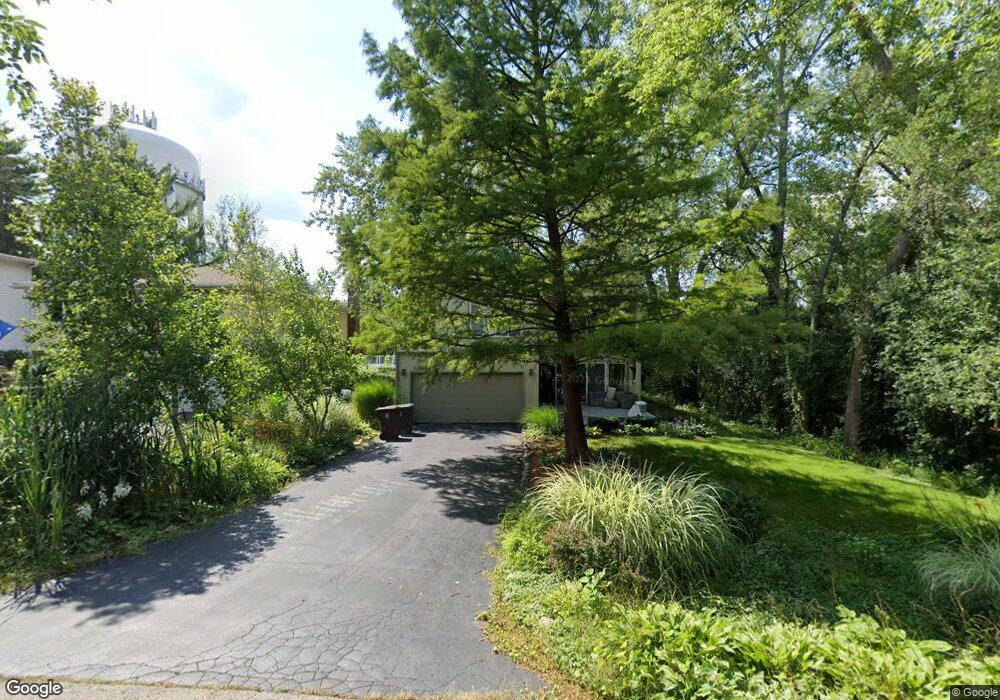
18040 Stewart Ave Homewood, IL 60430
Estimated Value: $364,064 - $484,000
4
Beds
2
Baths
3,057
Sq Ft
$135/Sq Ft
Est. Value
About This Home
This home is located at 18040 Stewart Ave, Homewood, IL 60430 and is currently estimated at $413,016, approximately $135 per square foot. 18040 Stewart Ave is a home located in Cook County with nearby schools including Willow Elementary School, Winston Churchill School, and James Hart School.
Ownership History
Date
Name
Owned For
Owner Type
Purchase Details
Closed on
Jul 6, 2017
Sold by
Widmer Wayne and Widmer Mary
Bought by
Quirke Nicholas W and Quirke Jennifer A
Current Estimated Value
Home Financials for this Owner
Home Financials are based on the most recent Mortgage that was taken out on this home.
Original Mortgage
$243,900
Outstanding Balance
$202,751
Interest Rate
3.91%
Mortgage Type
New Conventional
Estimated Equity
$210,265
Purchase Details
Closed on
Mar 12, 2013
Sold by
Widmer Wayne and Widmer Mary
Bought by
Widmer Wayne and Widmer Mary
Purchase Details
Closed on
Dec 1, 1994
Sold by
Mitchell James W
Bought by
Widmer Wayne and Widmer Mary
Home Financials for this Owner
Home Financials are based on the most recent Mortgage that was taken out on this home.
Original Mortgage
$75,000
Interest Rate
6%
Create a Home Valuation Report for This Property
The Home Valuation Report is an in-depth analysis detailing your home's value as well as a comparison with similar homes in the area
Home Values in the Area
Average Home Value in this Area
Purchase History
| Date | Buyer | Sale Price | Title Company |
|---|---|---|---|
| Quirke Nicholas W | $271,000 | Old Republic Title | |
| Widmer Wayne | -- | None Available | |
| Widmer Wayne | $172,000 | -- |
Source: Public Records
Mortgage History
| Date | Status | Borrower | Loan Amount |
|---|---|---|---|
| Open | Quirke Nicholas W | $243,900 | |
| Previous Owner | Widmer Wayne | $75,000 |
Source: Public Records
Tax History Compared to Growth
Tax History
| Year | Tax Paid | Tax Assessment Tax Assessment Total Assessment is a certain percentage of the fair market value that is determined by local assessors to be the total taxable value of land and additions on the property. | Land | Improvement |
|---|---|---|---|---|
| 2024 | $12,112 | $33,000 | $1,641 | $31,359 |
| 2023 | $8,550 | $33,000 | $1,641 | $31,359 |
| 2022 | $8,550 | $20,176 | $1,406 | $18,770 |
| 2021 | $8,013 | $20,176 | $1,406 | $18,770 |
| 2020 | $10,191 | $25,149 | $1,406 | $23,743 |
| 2019 | $9,071 | $22,348 | $1,250 | $21,098 |
| 2018 | $8,774 | $22,348 | $1,250 | $21,098 |
| 2017 | $8,828 | $22,348 | $1,250 | $21,098 |
| 2016 | $8,271 | $19,861 | $1,093 | $18,768 |
| 2015 | $8,151 | $19,861 | $1,093 | $18,768 |
| 2014 | $8,021 | $19,861 | $1,093 | $18,768 |
| 2013 | $8,222 | $21,898 | $1,093 | $20,805 |
Source: Public Records
Map
Nearby Homes
- 18157 Rockwell Ave
- 18210 Perth Ave
- 18051 Los Angeles Ave
- 18330 Perth Ave
- 17731 Larkspur Ln
- 18404 Perth Ave
- 17805 Dogwood Ln
- 17803 Dogwood Ln
- 18104 Park Ave
- 18340 Cherry Creek Dr Unit 7
- 18418 Clyde Rd
- 17649 Dundee Ave
- 2163 Chestnut Rd
- 2451 Hawthorne Rd
- 2612 Turtle Creek Dr
- 17714 Dogwood Ln
- 17804 Pebblewood Ln
- 2908 Buttonwood Walk
- 18450 Stedhall Rd
- 18400 Cherry Creek Dr Unit 105
- 18042 Stewart Ave
- 18048 Stewart Ave
- 18048 Stewart Ave
- 18041 Stewart Ave
- 18057 Stewart Ave
- 2530 Hickory Rd
- 2534 Hickory Rd
- 18047 Stewart Ave
- 18047 Stewart Ave
- 2518 Hickory Rd
- 2518 Hickory Rd
- 2515 Lawrence Ln
- 18020 Perth Ave
- 2508 Hickory Rd
- 18034 Perth Ave
- 18034 Perth Ave
- 2509 Lawrence Ln
- 2502 Hickory Rd
- 2502 Hickory Rd
- 18106 Stewart Ave