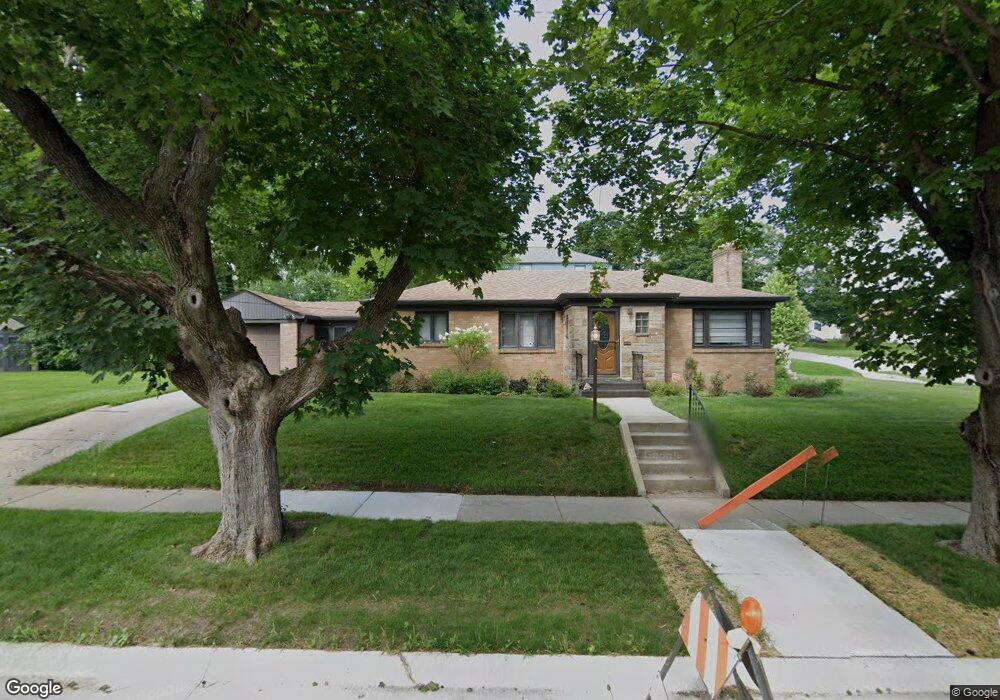
1805 22nd St Rockford, IL 61108
Keith Creek NeighborhoodEstimated Value: $134,000 - $164,000
2
Beds
1
Bath
1,161
Sq Ft
$124/Sq Ft
Est. Value
About This Home
This home is located at 1805 22nd St, Rockford, IL 61108 and is currently estimated at $143,955, approximately $123 per square foot. 1805 22nd St is a home located in Winnebago County with nearby schools including Whitehead Elementary School, Bernard W. Flinn Middle School, and Rockford East High School.
Ownership History
Date
Name
Owned For
Owner Type
Purchase Details
Closed on
Sep 24, 2021
Sold by
Cazaniga Sr Gerald J and Cazaniga Natividad M
Bought by
Gerald J Cazaniga Sr And Natividad M Cazaniga and Cazaniga Nativ
Current Estimated Value
Purchase Details
Closed on
Sep 20, 2021
Sold by
Cazaniga Gerald J and Cazaniga Natividad M
Bought by
Gerald J Cazaniga Sr And Natividad M Cazaniga and Harker
Purchase Details
Closed on
Sep 17, 2021
Sold by
Cazaniga Sr Gerald J and Cazaniga Natividad M
Bought by
Gerald J Cazaniga Sr And Natividad M Cazaniga
Create a Home Valuation Report for This Property
The Home Valuation Report is an in-depth analysis detailing your home's value as well as a comparison with similar homes in the area
Home Values in the Area
Average Home Value in this Area
Purchase History
| Date | Buyer | Sale Price | Title Company |
|---|---|---|---|
| Gerald J Cazaniga Sr And Natividad M Cazaniga | -- | Janas Craig A | |
| Gerald J Cazaniga Sr And Natividad M Cazaniga | -- | None Listed On Document | |
| Gerald J Cazaniga Sr And Natividad M Cazaniga | -- | Janas Craig A |
Source: Public Records
Tax History Compared to Growth
Tax History
| Year | Tax Paid | Tax Assessment Tax Assessment Total Assessment is a certain percentage of the fair market value that is determined by local assessors to be the total taxable value of land and additions on the property. | Land | Improvement |
|---|---|---|---|---|
| 2024 | $2,289 | $35,157 | $5,090 | $30,067 |
| 2023 | $2,077 | $31,000 | $4,488 | $26,512 |
| 2022 | $1,909 | $27,708 | $4,011 | $23,697 |
| 2021 | $1,766 | $25,406 | $3,678 | $21,728 |
| 2020 | $1,674 | $24,018 | $3,477 | $20,541 |
| 2019 | $1,593 | $22,892 | $3,314 | $19,578 |
| 2018 | $1,772 | $23,418 | $3,122 | $20,296 |
| 2017 | $1,693 | $22,412 | $2,988 | $19,424 |
| 2016 | $1,660 | $21,992 | $2,932 | $19,060 |
| 2015 | $841 | $21,992 | $2,932 | $19,060 |
| 2014 | $1,916 | $23,235 | $3,658 | $19,577 |
Source: Public Records
Map
Nearby Homes