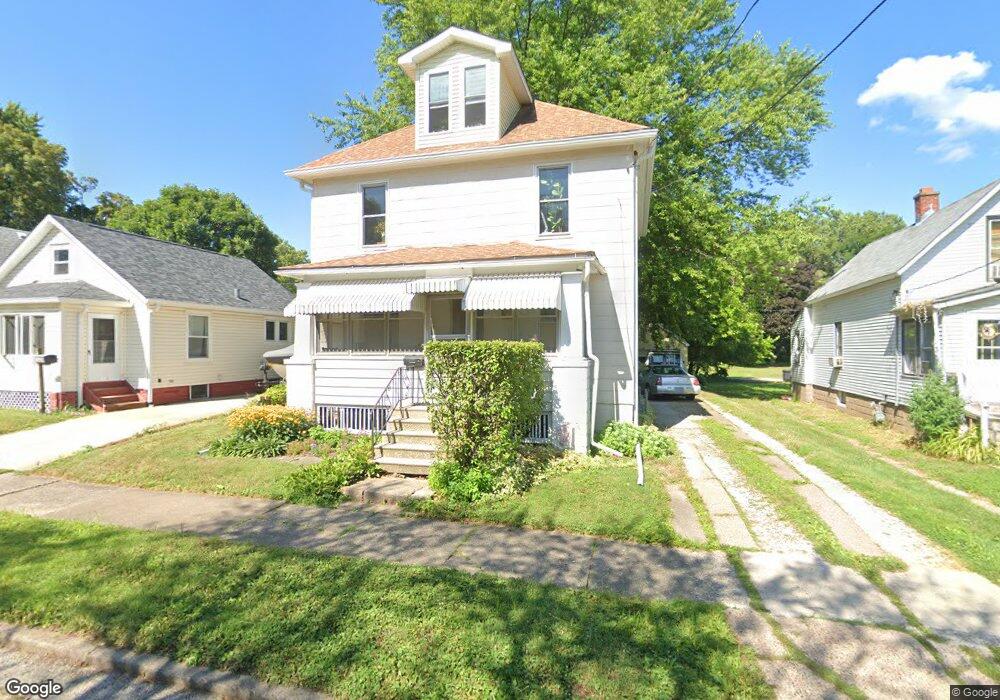
1805 2nd St Moline, IL 61265
Old Towne NeighborhoodEstimated Value: $80,798 - $153,000
3
Beds
--
Bath
1,512
Sq Ft
$76/Sq Ft
Est. Value
About This Home
This home is located at 1805 2nd St, Moline, IL 61265 and is currently estimated at $114,950, approximately $76 per square foot. 1805 2nd St is a home located in Rock Island County with nearby schools including Hamilton Elementary School, John Deere Middle School, and Moline Sr High School.
Ownership History
Date
Name
Owned For
Owner Type
Purchase Details
Closed on
Aug 31, 2023
Sold by
Sink John Stephen
Bought by
Stroup Eisen N and Stroup Shauna
Current Estimated Value
Home Financials for this Owner
Home Financials are based on the most recent Mortgage that was taken out on this home.
Original Mortgage
$53,000
Outstanding Balance
$51,884
Interest Rate
7%
Mortgage Type
New Conventional
Estimated Equity
$63,066
Purchase Details
Closed on
Nov 11, 2021
Sold by
Sink Vicki C
Bought by
Sink John Stephen
Create a Home Valuation Report for This Property
The Home Valuation Report is an in-depth analysis detailing your home's value as well as a comparison with similar homes in the area
Home Values in the Area
Average Home Value in this Area
Purchase History
| Date | Buyer | Sale Price | Title Company |
|---|---|---|---|
| Stroup Eisen N | $60,000 | Gomez Title | |
| Sink John Stephen | -- | Ames Law Offices |
Source: Public Records
Mortgage History
| Date | Status | Borrower | Loan Amount |
|---|---|---|---|
| Open | Stroup Eisen N | $53,000 |
Source: Public Records
Tax History
| Year | Tax Paid | Tax Assessment Tax Assessment Total Assessment is a certain percentage of the fair market value that is determined by local assessors to be the total taxable value of land and additions on the property. | Land | Improvement |
|---|---|---|---|---|
| 2024 | $2,227 | $31,241 | $5,129 | $26,112 |
| 2023 | $2,756 | $29,867 | $4,903 | $24,964 |
| 2022 | $1,398 | $29,684 | $4,903 | $24,781 |
| 2021 | $1,459 | $28,352 | $4,683 | $23,669 |
| 2020 | $1,475 | $28,183 | $4,655 | $23,528 |
| 2019 | $1,467 | $27,523 | $4,546 | $22,977 |
| 2018 | $1,467 | $26,917 | $4,492 | $22,425 |
| 2017 | $1,942 | $26,364 | $4,400 | $21,964 |
| 2016 | $1,909 | $25,923 | $4,326 | $21,597 |
| 2015 | $1,857 | $25,390 | $4,237 | $21,153 |
| 2014 | $463 | $26,207 | $4,374 | $21,833 |
| 2013 | $463 | $26,207 | $4,374 | $21,833 |
Source: Public Records
Map
Nearby Homes
Your Personal Tour Guide
Ask me questions while you tour the home.