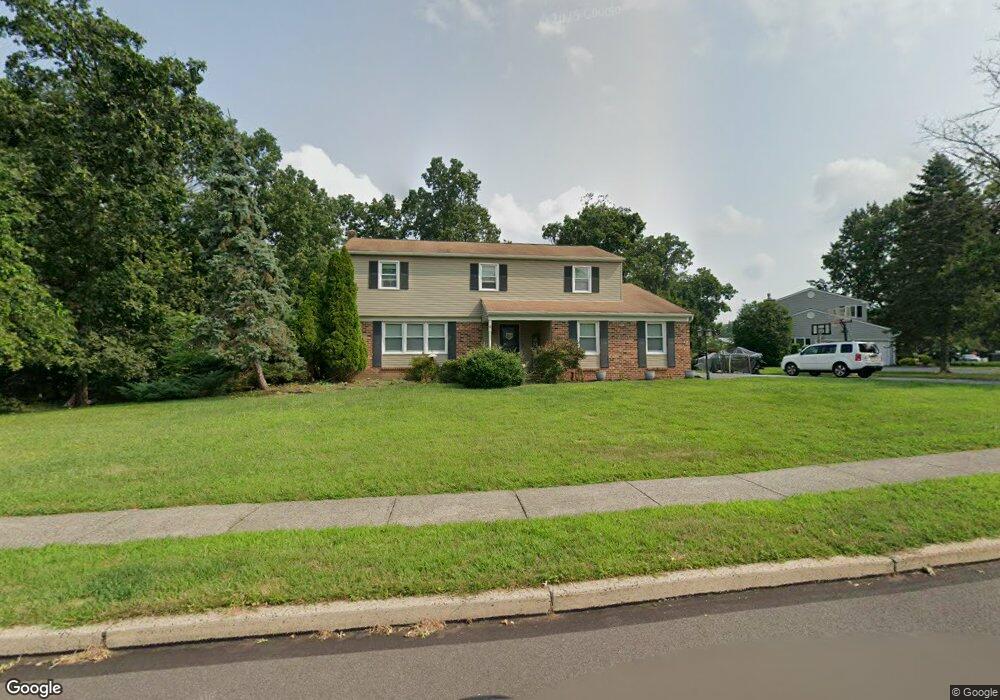
1805 Beth Ln Lansdale, PA 19446
Estimated Value: $606,000 - $705,000
4
Beds
3
Baths
2,194
Sq Ft
$297/Sq Ft
Est. Value
About This Home
This home is located at 1805 Beth Ln, Lansdale, PA 19446 and is currently estimated at $651,067, approximately $296 per square foot. 1805 Beth Ln is a home located in Montgomery County with nearby schools including General Nash El School, Pennfield Middle School, and North Penn Senior High School.
Ownership History
Date
Name
Owned For
Owner Type
Purchase Details
Closed on
Aug 30, 2021
Sold by
Drazul Galbally Michelle L and Galbally Edward J
Bought by
Drazul Galbally Michelle L and Galbally Edward J
Current Estimated Value
Home Financials for this Owner
Home Financials are based on the most recent Mortgage that was taken out on this home.
Original Mortgage
$232,000
Outstanding Balance
$211,103
Interest Rate
2.8%
Mortgage Type
New Conventional
Estimated Equity
$439,964
Purchase Details
Closed on
May 8, 2010
Sold by
Vanwye Marcia and Van Wye Alice A
Bought by
Galbally Edward J and Drazul Michelle L
Home Financials for this Owner
Home Financials are based on the most recent Mortgage that was taken out on this home.
Original Mortgage
$282,320
Interest Rate
5.03%
Purchase Details
Closed on
Sep 5, 2003
Sold by
Vanwye Alice A
Bought by
Vanwye Alice A Tr and Vanwye David Tr
Create a Home Valuation Report for This Property
The Home Valuation Report is an in-depth analysis detailing your home's value as well as a comparison with similar homes in the area
Home Values in the Area
Average Home Value in this Area
Purchase History
| Date | Buyer | Sale Price | Title Company |
|---|---|---|---|
| Drazul Galbally Michelle L | -- | None Available | |
| Galbally Edward J | $352,900 | None Available | |
| Vanwye Alice A Tr | -- | -- |
Source: Public Records
Mortgage History
| Date | Status | Borrower | Loan Amount |
|---|---|---|---|
| Open | Drazul Galbally Michelle L | $232,000 | |
| Closed | Galbally Edward J | $282,320 |
Source: Public Records
Tax History Compared to Growth
Tax History
| Year | Tax Paid | Tax Assessment Tax Assessment Total Assessment is a certain percentage of the fair market value that is determined by local assessors to be the total taxable value of land and additions on the property. | Land | Improvement |
|---|---|---|---|---|
| 2025 | $7,333 | $181,040 | -- | -- |
| 2024 | $7,333 | $181,040 | -- | -- |
| 2023 | $6,731 | $173,540 | $55,120 | $118,420 |
| 2022 | $6,318 | $173,540 | $55,120 | $118,420 |
| 2021 | $6,135 | $173,540 | $55,120 | $118,420 |
| 2020 | $5,857 | $173,540 | $55,120 | $118,420 |
| 2019 | $5,756 | $173,540 | $55,120 | $118,420 |
| 2018 | $1,157 | $173,540 | $55,120 | $118,420 |
| 2017 | $5,527 | $173,540 | $55,120 | $118,420 |
| 2016 | $5,459 | $173,540 | $55,120 | $118,420 |
| 2015 | $5,360 | $173,540 | $55,120 | $118,420 |
| 2014 | $5,231 | $173,540 | $55,120 | $118,420 |
Source: Public Records
Map
Nearby Homes
- 1808 Beth Ln
- 1653 Bridle Path Dr
- 109 Durham Ct
- 1381 Village Way
- 103 Newport Ct
- 111 Newport Ct
- 172 Oberlin Terrace
- 1040 Hunter Hill Dr
- 144 Oberlin Terrace Unit 15-B
- 177 Oberlin Terrace Unit 18-L
- 578 Harrington Ct
- 210 Berwick Place Unit 20E
- 2234 Locust Dr
- 108 Hickory Ct
- 102 Ridgewood Way
- 2272 Locust Dr
- 1627 Clearbrook Rd
- 980 Jacks Ln
- 907A Stockton Ct
- 1207B Crosshill Ct
- 1803 Beth Ln
- 1802 Beth Ln
- 1801 Beth Ln
- 1804 Beth Ln
- 1806 Beth Ln
- 1800 Beth Ln
- 1799 Beth Ln
- 1800 Theresa Way
- 1801 Theresa Way
- 1810 Beth Ln
- 1888 Rampart Ln
- 2075 Pheasant Hill Rd
- 2069 Pheasant Hill Rd
- 1798 Beth Ln
- 1803 Theresa Way
- 2081 Pheasant Hill Rd
- 2067 Pheasant Hill Rd
- 1890 Rampart Ln
- 2087 Pheasant Hill Rd
- 1804 Theresa Way