
Seller's Agent in 2016
Joann Mahan
OZMENT REAL ESTATE
(618) 926-1837
39 in this area
67 Total Sales
Estimated Value: $66,000 - $210,000
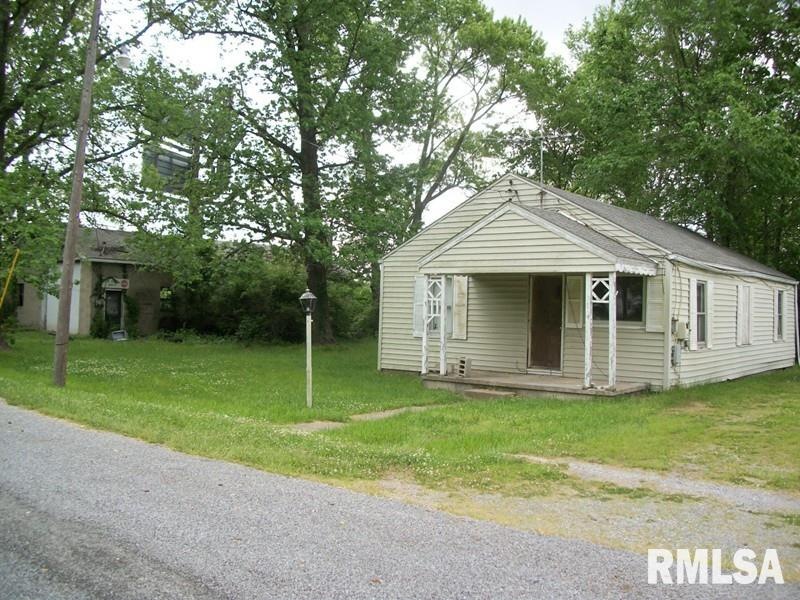
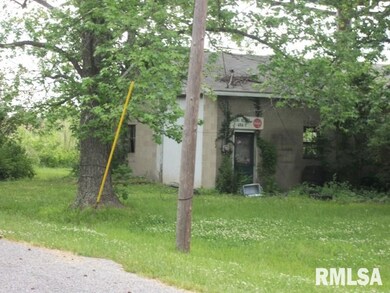
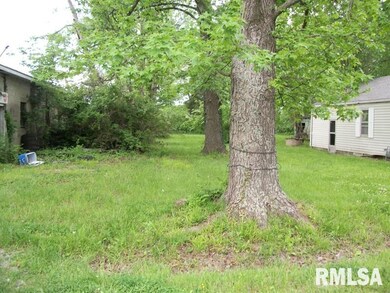
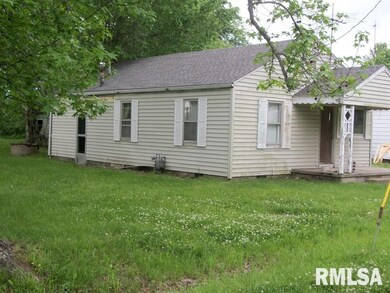
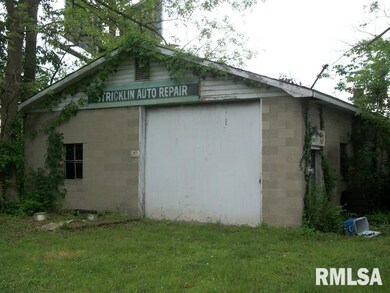
3 Plus Lots on South side of Chestnut St. Old home on property is given No value. Needs to be torn down. Block garage has concrete floor. Lamar Billboard pays $1800/year. Was renewed in 2007 for 10 more years.
Last Agent to Sell the Property
OZMENT REAL ESTATE License #475129594 Listed on: 05/08/2015
| Date | Event | Price | List to Sale | Price per Sq Ft |
|---|---|---|---|---|
| 04/18/2016 04/18/16 | Sold | $23,000 | -34.1% | -- |
| 03/19/2016 03/19/16 | Pending | -- | -- | -- |
| 05/08/2015 05/08/15 | For Sale | $34,900 | -- | -- |
| Year | Tax Paid | Tax Assessment Tax Assessment Total Assessment is a certain percentage of the fair market value that is determined by local assessors to be the total taxable value of land and additions on the property. | Land | Improvement |
|---|---|---|---|---|
| 2024 | $805 | $8,987 | $601 | $8,386 |
| 2023 | $752 | $7,617 | $509 | $7,108 |
| 2022 | $742 | $7,181 | $480 | $6,701 |
| 2021 | $768 | $7,403 | $495 | $6,908 |
| 2020 | $759 | $7,181 | $480 | $6,701 |
| 2019 | $773 | $7,181 | $480 | $6,701 |
| 2018 | $782 | $7,181 | $480 | $6,701 |
| 2017 | $430 | $4,010 | $480 | $3,530 |
| 2016 | $4 | $4,010 | $480 | $3,530 |
| 2015 | -- | $4,010 | $480 | $3,530 |
| 2014 | $690 | $4,010 | $480 | $3,530 |
| 2013 | $690 | $4,010 | $480 | $3,530 |
| 2012 | $690 | $4,010 | $480 | $3,530 |
Seller's Agent in 2016
Joann Mahan
OZMENT REAL ESTATE
(618) 926-1837
39 in this area
67 Total Sales
K
Buyer's Agent in 2016
KAREN FOSTER
OZMENT REAL ESTATE
(618) 841-1059
18 in this area
26 Total Sales
Source: RMLS Alliance
MLS Number: RMAEB333350
APN: 06-2-434-10
Disclaimer: Certain information contained herein is derived from information provided by parties other than Homes.com. All information provided is deemed reliable, but is not guaranteed to be accurate and should be independently verified.
![]() IDX information is provided exclusively for personal, non-commercial use, and may not be used for any purpose other than to identify prospective properties consumers may be interested in purchasing. Information is deemed reliable but not guaranteed.
IDX information is provided exclusively for personal, non-commercial use, and may not be used for any purpose other than to identify prospective properties consumers may be interested in purchasing. Information is deemed reliable but not guaranteed.