Estimated Value: $389,977 - $490,000
3
Beds
3
Baths
2,548
Sq Ft
$175/Sq Ft
Est. Value
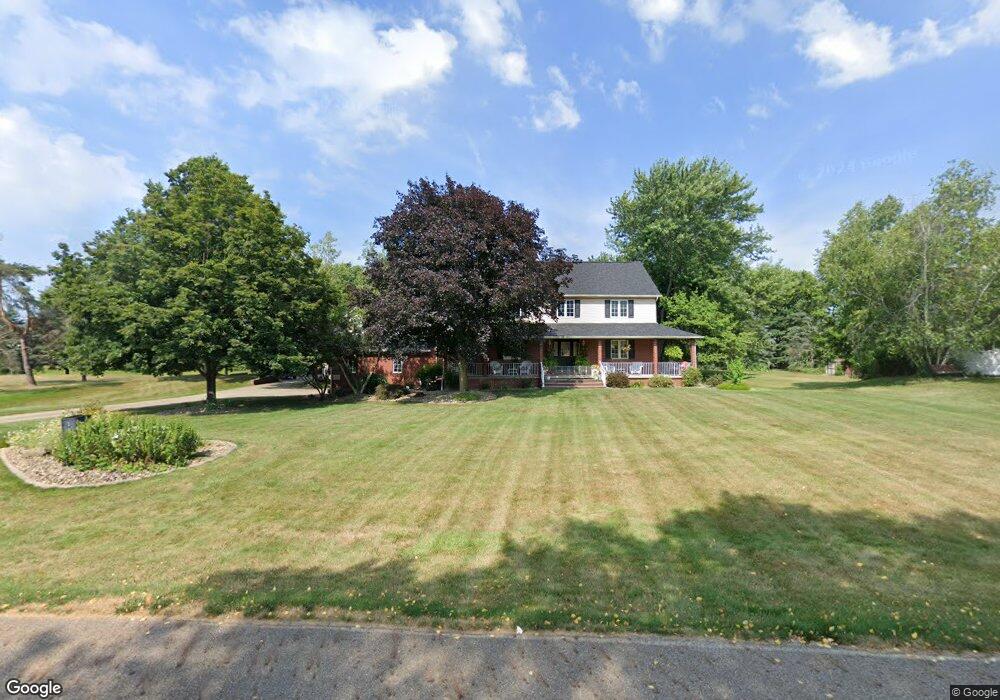
About This Home
This home is located at 1805 Countryside Dr, Salem, OH 44460 and is currently estimated at $446,992, approximately $175 per square foot. 1805 Countryside Dr is a home located in Columbiana County with nearby schools including Buckeye Elementary School, Reilly Elementary School, and Salem Junior High School.
Ownership History
Date
Name
Owned For
Owner Type
Purchase Details
Closed on
Oct 4, 2012
Sold by
Umbel Janet M
Bought by
Wilms John R and Wilms Lisa
Current Estimated Value
Home Financials for this Owner
Home Financials are based on the most recent Mortgage that was taken out on this home.
Original Mortgage
$224,675
Outstanding Balance
$156,675
Interest Rate
3.66%
Mortgage Type
New Conventional
Estimated Equity
$290,317
Purchase Details
Closed on
Aug 7, 2012
Sold by
Parker Clinton L
Bought by
Umbel Janet M
Home Financials for this Owner
Home Financials are based on the most recent Mortgage that was taken out on this home.
Original Mortgage
$224,675
Outstanding Balance
$156,675
Interest Rate
3.66%
Mortgage Type
New Conventional
Estimated Equity
$290,317
Purchase Details
Closed on
Jun 20, 1991
Bought by
Dankovich Stephen A
Purchase Details
Closed on
Jun 12, 1991
Sold by
Dankovich Stephen A
Bought by
Home Bldrs Assn
Create a Home Valuation Report for This Property
The Home Valuation Report is an in-depth analysis detailing your home's value as well as a comparison with similar homes in the area
Home Values in the Area
Average Home Value in this Area
Purchase History
| Date | Buyer | Sale Price | Title Company |
|---|---|---|---|
| Wilms John R | $236,500 | Heritage Union Title Co Ltd | |
| Umbel Janet M | $119,100 | Heritage Union Title Co | |
| Dankovich Stephen A | -- | -- | |
| Home Bldrs Assn | $11,000 | -- |
Source: Public Records
Mortgage History
| Date | Status | Borrower | Loan Amount |
|---|---|---|---|
| Open | Wilms John R | $224,675 |
Source: Public Records
Tax History Compared to Growth
Tax History
| Year | Tax Paid | Tax Assessment Tax Assessment Total Assessment is a certain percentage of the fair market value that is determined by local assessors to be the total taxable value of land and additions on the property. | Land | Improvement |
|---|---|---|---|---|
| 2024 | $4,434 | $106,480 | $10,470 | $96,010 |
| 2023 | $4,446 | $106,480 | $10,470 | $96,010 |
| 2022 | $4,132 | $106,480 | $10,470 | $96,010 |
| 2021 | $3,750 | $89,750 | $10,540 | $79,210 |
| 2020 | $3,779 | $89,750 | $10,540 | $79,210 |
| 2019 | $3,651 | $86,740 | $10,540 | $76,200 |
| 2018 | $3,488 | $78,860 | $9,590 | $69,270 |
| 2017 | $3,486 | $78,860 | $9,590 | $69,270 |
| 2016 | $3,508 | $78,090 | $11,130 | $66,960 |
| 2015 | $3,508 | $78,090 | $11,130 | $66,960 |
| 2014 | $3,407 | $78,090 | $11,130 | $66,960 |
Source: Public Records
Map
Nearby Homes
- 1222 Benton Rd
- 1300 Jennings Ave
- 389 W 16th St
- 0 Maryland Ave
- 631 W 8th St
- 605 W 7th St
- 12205 Goshen Rd Unit 56
- 1372 W State St
- 1097 N Ellsworth Ave
- 12751 S Salem-Warren Rd
- 14609 S Duck Creek Rd
- 174 W 5th St
- 152 & 158 W 5th St
- 492 N Ellsworth Ave
- 10 W View Ave
- 11 W View Ave
- 5 W View Ave
- Lot 2 W View Ave
- Lot 4 W View Ave
- 13050 Diagonal Rd
- 1827 Countryside Dr
- 1839 Countryside Dr
- 1810 Countryside Dr
- 1824 Countryside Dr
- 1318 Beechwood Rd
- 1858 Allen Rd
- 1872 Allen Rd
- 1842 Allen Rd
- 1368 Beechwood Rd
- 1292 Beechwood Rd
- 1282 Beechwood Rd
- 1888 Allen Rd
- 1877 Countryside Dr
- 1378 Beechwood Rd
- 1272 Hampton Place
- 1834 Allen Rd
- 1276 Beechwood Rd
- 1906 Allen Rd
- 1828 Allen Rd
- 1333 Beechwood Rd