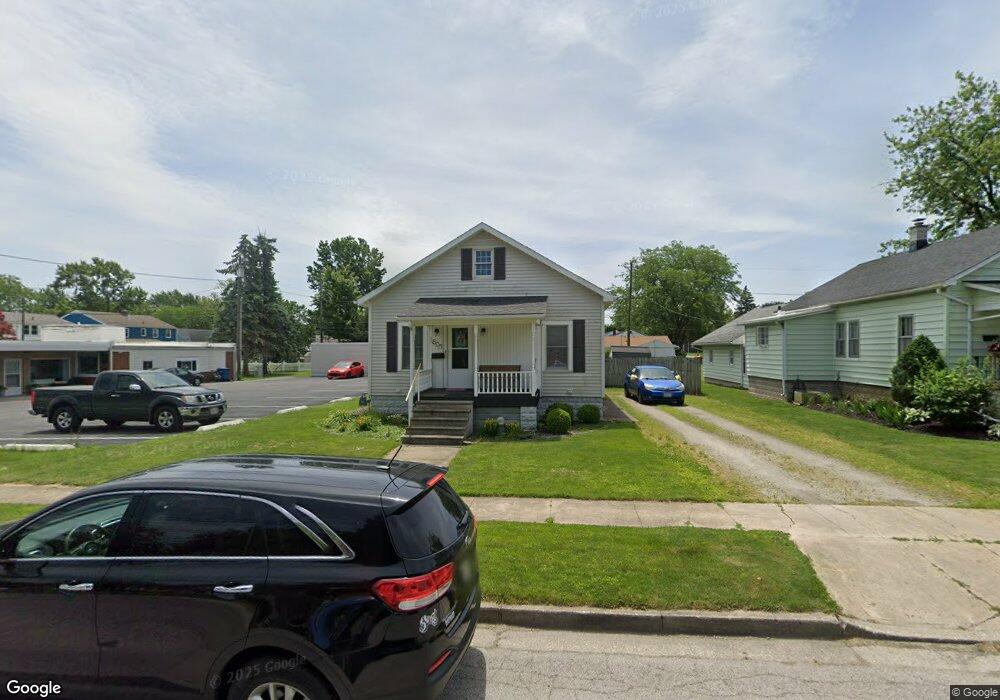
1805 Croghan St Fremont, OH 43420
Estimated Value: $123,000 - $150,000
2
Beds
1
Bath
1,377
Sq Ft
$100/Sq Ft
Est. Value
About This Home
This home is located at 1805 Croghan St, Fremont, OH 43420 and is currently estimated at $137,442, approximately $99 per square foot. 1805 Croghan St is a home located in Sandusky County with nearby schools including Fremont Ross High School, St. Joseph School, and Bishop Hoffman Catholic School - This is St Joe's School now.
Ownership History
Date
Name
Owned For
Owner Type
Purchase Details
Closed on
May 7, 2008
Sold by
Us Bank Na
Bought by
Reiter Paul J
Current Estimated Value
Purchase Details
Closed on
Nov 26, 2007
Sold by
Gillmor Gerald R and Case #06-Cv-1248
Bought by
Us Bank Na
Purchase Details
Closed on
Nov 17, 1997
Sold by
John G Rusch
Bought by
Federal National Mortgage Assn
Purchase Details
Closed on
Dec 8, 1995
Sold by
Troy D Hotz
Bought by
John G Rusch
Home Financials for this Owner
Home Financials are based on the most recent Mortgage that was taken out on this home.
Original Mortgage
$60,750
Interest Rate
7.52%
Mortgage Type
New Conventional
Purchase Details
Closed on
Jan 1, 1991
Sold by
Gillmor Gerald and Gillmor Cynthia
Bought by
Reiter Paul J
Purchase Details
Closed on
Jun 1, 1989
Bought by
Reiter Paul J
Create a Home Valuation Report for This Property
The Home Valuation Report is an in-depth analysis detailing your home's value as well as a comparison with similar homes in the area
Home Values in the Area
Average Home Value in this Area
Purchase History
| Date | Buyer | Sale Price | Title Company |
|---|---|---|---|
| Reiter Paul J | $30,375 | Progressive Land Title | |
| Us Bank Na | $42,000 | Sandusky Bay Title | |
| Federal National Mortgage Assn | $61,000 | -- | |
| John G Rusch | $67,500 | -- | |
| Reiter Paul J | $38,000 | -- | |
| Reiter Paul J | $37,500 | -- |
Source: Public Records
Mortgage History
| Date | Status | Borrower | Loan Amount |
|---|---|---|---|
| Previous Owner | John G Rusch | $60,750 |
Source: Public Records
Tax History Compared to Growth
Tax History
| Year | Tax Paid | Tax Assessment Tax Assessment Total Assessment is a certain percentage of the fair market value that is determined by local assessors to be the total taxable value of land and additions on the property. | Land | Improvement |
|---|---|---|---|---|
| 2024 | $1,321 | $35,040 | $8,090 | $26,950 |
| 2023 | $1,321 | $27,800 | $6,410 | $21,390 |
| 2022 | $1,101 | $27,800 | $6,410 | $21,390 |
| 2021 | $1,137 | $27,800 | $6,410 | $21,390 |
| 2020 | $901 | $21,710 | $6,410 | $15,300 |
| 2019 | $900 | $21,710 | $6,410 | $15,300 |
| 2018 | $902 | $21,710 | $6,410 | $15,300 |
| 2017 | $874 | $20,970 | $6,410 | $14,560 |
| 2016 | $769 | $20,970 | $6,410 | $14,560 |
| 2015 | $756 | $20,970 | $6,410 | $14,560 |
| 2014 | $797 | $21,070 | $6,440 | $14,630 |
| 2013 | $780 | $21,070 | $6,440 | $14,630 |
Source: Public Records
Map
Nearby Homes
- 115 N Taft Ave
- 125 Austin St Unit 125
- 1611 Mcpherson Blvd
- 1342 Mcpherson Blvd
- 614 3rd Ave
- 2119 Lake St
- 515 Everett Rd
- 520 Everett Rd
- 1009 Napoleon St
- 880 Cleveland Ave
- 1015 Hayes Ave
- 1823 W State St
- 920 Garrison St
- 816 Lime St
- 927 Wolfe Ave
- 1028 June St
- 1485 Autumn Woods Dr
- 1719 Buckland Ave
- 822 Upton Rd
- 818 Franklin Ave
- 1807 Croghan St
- 115 S Taft Ave
- 1901 Croghan St
- 119 S Taft Ave
- 108 S Taft Ave
- 108 S Granville Blvd
- 108 N Taft Ave
- 112 S Granville Blvd
- 1806 Croghan St
- 1903 Croghan St
- 1804 Croghan St
- 1808 Croghan St
- 116 S Granville Blvd
- 100 N Granville Blvd
- 112 N Granville Blvd
- 114 S Taft Ave
- 114 N Taft Ave
- 102 N Taft Ave
- 116 N Granville Blvd
- 1905 Croghan St