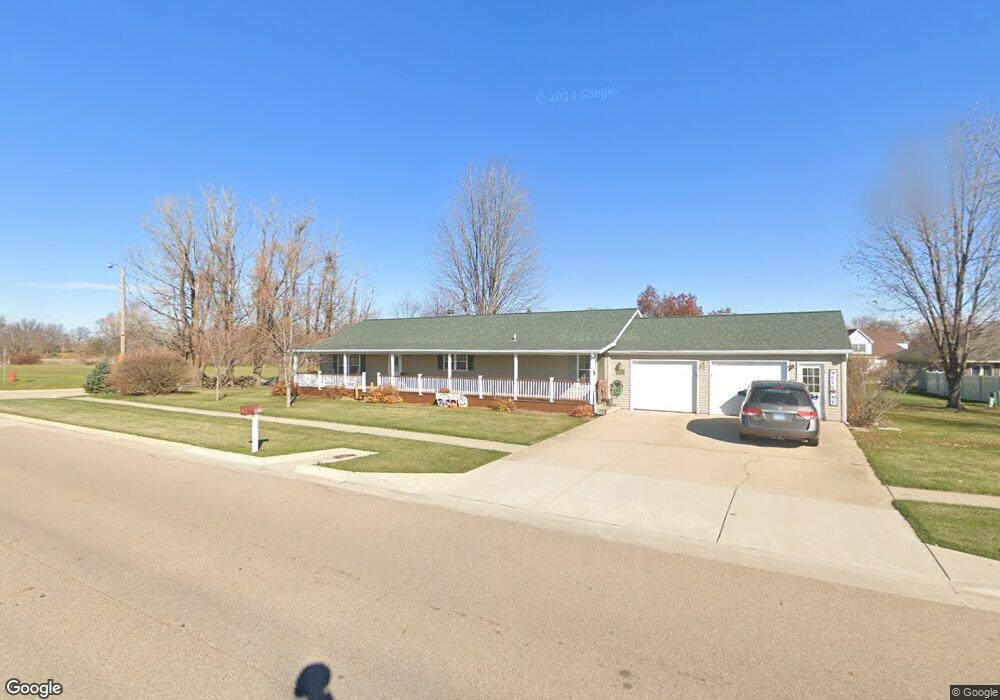
1805 E Main St Mendota, IL 61342
Estimated Value: $218,136 - $268,000
Studio
--
Bath
1,530
Sq Ft
$162/Sq Ft
Est. Value
About This Home
This home is located at 1805 E Main St, Mendota, IL 61342 and is currently estimated at $247,284, approximately $161 per square foot. 1805 E Main St is a home located in LaSalle County with nearby schools including Northbrook School, Blackstone Elementary School, and Lincoln Elementary School.
Ownership History
Date
Name
Owned For
Owner Type
Purchase Details
Closed on
Aug 10, 2005
Sold by
Garcia George
Bought by
Novak Jenelle
Current Estimated Value
Purchase Details
Closed on
May 24, 2005
Sold by
Aughenbaugh David L and Aughenbaugh Jan D
Bought by
Garcia George and Novak Janelle
Home Financials for this Owner
Home Financials are based on the most recent Mortgage that was taken out on this home.
Original Mortgage
$156,750
Interest Rate
4.75%
Mortgage Type
Adjustable Rate Mortgage/ARM
Create a Home Valuation Report for This Property
The Home Valuation Report is an in-depth analysis detailing your home's value as well as a comparison with similar homes in the area
Home Values in the Area
Average Home Value in this Area
Purchase History
| Date | Buyer | Sale Price | Title Company |
|---|---|---|---|
| Novak Jenelle | -- | None Available | |
| Garcia George | $165,000 | None Available |
Source: Public Records
Mortgage History
| Date | Status | Borrower | Loan Amount |
|---|---|---|---|
| Previous Owner | Garcia George | $156,750 |
Source: Public Records
Tax History
| Year | Tax Paid | Tax Assessment Tax Assessment Total Assessment is a certain percentage of the fair market value that is determined by local assessors to be the total taxable value of land and additions on the property. | Land | Improvement |
|---|---|---|---|---|
| 2024 | $4,965 | $63,313 | $8,311 | $55,002 |
| 2023 | $4,585 | $58,962 | $7,740 | $51,222 |
| 2022 | $4,194 | $53,753 | $7,056 | $46,697 |
| 2021 | $4,145 | $50,883 | $6,679 | $44,204 |
| 2020 | $3,867 | $48,043 | $6,306 | $41,737 |
| 2019 | $3,922 | $46,811 | $6,306 | $40,505 |
| 2018 | $3,923 | $45,786 | $6,168 | $39,618 |
| 2017 | $3,967 | $45,207 | $6,090 | $39,117 |
| 2016 | $3,807 | $43,281 | $5,831 | $37,450 |
| 2015 | $3,690 | $41,967 | $5,654 | $36,313 |
| 2012 | -- | $48,068 | $6,476 | $41,592 |
Source: Public Records
Map
Nearby Homes
Your Personal Tour Guide
Ask me questions while you tour the home.